Fig. 15
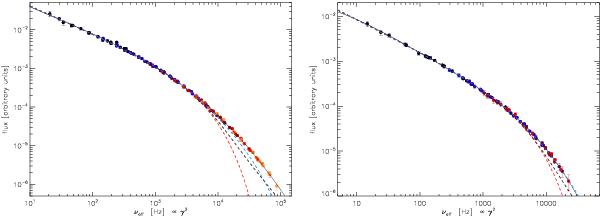
“Global” radio spectra for B1 (left) and B2+B3 (right). The spectrum for each αref spectral region from Fig. 13 has been shifted in log (I) − log (ν) space to create the “global” spectral shape. Fourth order polynomial fits through these data points are shown by solid thin black lines. JP (red), KP (black) and KGJP (blue) models are shown by the dashed lines. The color coding, based on the αref regions, is the same as in Fig. 13.
Current usage metrics show cumulative count of Article Views (full-text article views including HTML views, PDF and ePub downloads, according to the available data) and Abstracts Views on Vision4Press platform.
Data correspond to usage on the plateform after 2015. The current usage metrics is available 48-96 hours after online publication and is updated daily on week days.
Initial download of the metrics may take a while.