Fig. 14
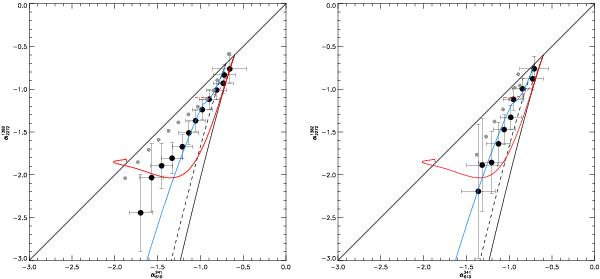
Color–color diagrams for B1 (left) and B2+B3 (right). Black data points are from the spectra displayed in Fig. 13. The solid black (slightly curved) line is a JP model with αinj = −0.6, the dashed black line a JP model with αinj = −0.7, the solid red line a KP model with αinj = −0.6, the dashed red line a CI model with αinj = −0.6, and the blue line a KGJP model with αinj = −0.7. The grey data points are for the same data as the black points, except the maps were smoothed with a 60′′ FWHM Gaussian. The  line is also shown for reference.

Current usage metrics show cumulative count of Article Views (full-text article views including HTML views, PDF and ePub downloads, according to the available data) and Abstracts Views on Vision4Press platform.
Data correspond to usage on the plateform after 2015. The current usage metrics is available 48-96 hours after online publication and is updated daily on week days.
Initial download of the metrics may take a while.