Fig. 13
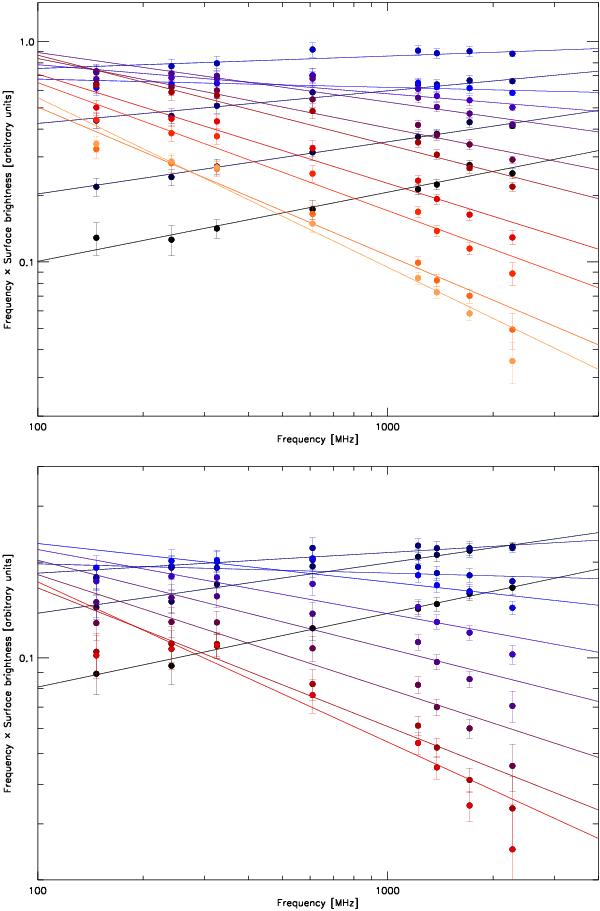
Normalized radio spectra for relic B1 (top) and B2+B3 (bottom). Each spectrum corresponds to a region from the spectral index map where αref − 0.05 < αref < αref + 0.05, with αref = −0.65, −0.75,..., −1.85 for B1, and αref = −0.75, −0.85,..., −1.65 for B2+B3. The spectra are plotted in log ν − log (νI) space to emphasize the differences between the spectra. First order polynomial fits, done in log (I) − log (ν) space, are shown by the solid lines to emphasize possible deviations from power-law radio spectra. Colors correspond to the different αref and go from black, blue, purple, red, to orange.
Current usage metrics show cumulative count of Article Views (full-text article views including HTML views, PDF and ePub downloads, according to the available data) and Abstracts Views on Vision4Press platform.
Data correspond to usage on the plateform after 2015. The current usage metrics is available 48-96 hours after online publication and is updated daily on week days.
Initial download of the metrics may take a while.