Fig. 11
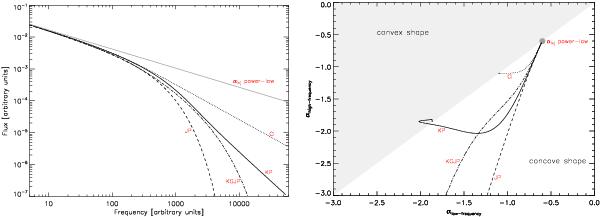
Overview of the spectral models used in this work (left) and corresponding radio color–color corves (right) to highlight differences in the spectral shapes. All spectral models have αinj = 0.6. Solid grey line and filled grey circle (in the color–color diagram): power-law spectrum without any ageing, solid black line: KP, dotted line: CI, dash-dotted line: KGJP, dashed line: JP. Note that a power-law spectrum will translate in a single point on a color–color diagram. The αlow−frequency = αhigh−frequency line divides concave and convex spectral shapes between the frequencies where the spectral index is computed.
Current usage metrics show cumulative count of Article Views (full-text article views including HTML views, PDF and ePub downloads, according to the available data) and Abstracts Views on Vision4Press platform.
Data correspond to usage on the plateform after 2015. The current usage metrics is available 48-96 hours after online publication and is updated daily on week days.
Initial download of the metrics may take a while.