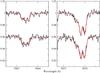
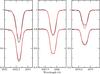
Fig. 9

Upper panel: LTE fit of strongly Zeeman split Fe iii lines at 5063 and 5074 Å with ⟨ |B| ⟩ = 4800 G and vsini = 3 km s-1. The fits are shown to the two spectra (#3 and #4) that clearly reveal splitting of the 5074 Å line. Lower panel: comparison of LTE fits to Si iii 4552, 4567 and 4574 lines in spectrum #3 with ξt = 5, vsini = 6 km s-1 and no magnetic field (upper curves), to LTE fits (lower curves) with the magnetic model of the upper panel.
Current usage metrics show cumulative count of Article Views (full-text article views including HTML views, PDF and ePub downloads, according to the available data) and Abstracts Views on Vision4Press platform.
Data correspond to usage on the plateform after 2015. The current usage metrics is available 48-96 hours after online publication and is updated daily on week days.
Initial download of the metrics may take a while.