Fig. 1
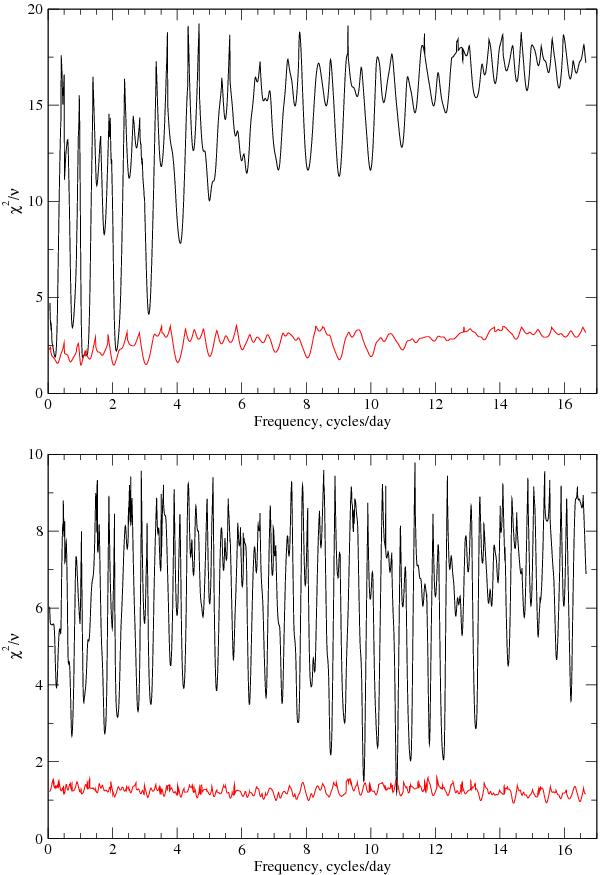
Frequency spectra of the goodness-of-fit parameter χ2/ν of least squares sine wave fit to 1987 (top) and 1990 (bottom) MB91 V magnitude data. The upper fit spectrum of each panel shows the fit spectrum to the original data. The lower spectrum of the top and bottom panels is the fit spectrum after a sine wave with frequency 1.155 c d-1 (period 0.866 d), amplitude 11.7 mmag, and with frequency 10.80 c d-1 (period 0.0926 d), amplitude 9.2 mmag respectively, and appropriate phase, has been subtracted from the measured V magnitudes.
Current usage metrics show cumulative count of Article Views (full-text article views including HTML views, PDF and ePub downloads, according to the available data) and Abstracts Views on Vision4Press platform.
Data correspond to usage on the plateform after 2015. The current usage metrics is available 48-96 hours after online publication and is updated daily on week days.
Initial download of the metrics may take a while.