Fig. 9
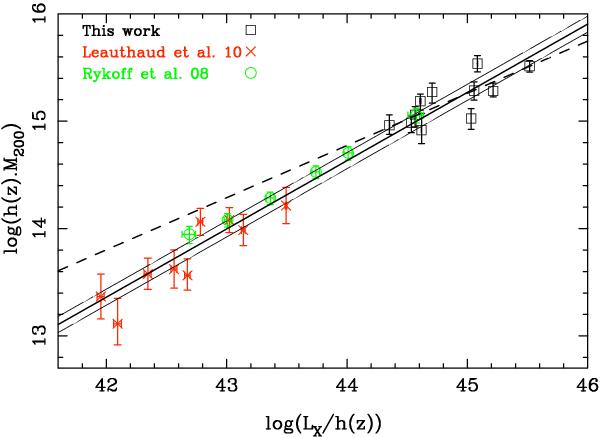
Weak-lensing masses versus X-ray luminosities using the EXCPRES clusters (black boxes) combined with the stacked clusters and groups of Rykoff et al. (2008) (green circles) and of Leauthaud et al. (2010) (red crosses). The solid lines show the best BCES fit and the corresponding intrinsic dispersion for the three data sets. For comparison, the BCES best fit obtained with only the EXCPRES weak lensing subsample is plotted (dashed line).
Current usage metrics show cumulative count of Article Views (full-text article views including HTML views, PDF and ePub downloads, according to the available data) and Abstracts Views on Vision4Press platform.
Data correspond to usage on the plateform after 2015. The current usage metrics is available 48-96 hours after online publication and is updated daily on week days.
Initial download of the metrics may take a while.