Fig. 8
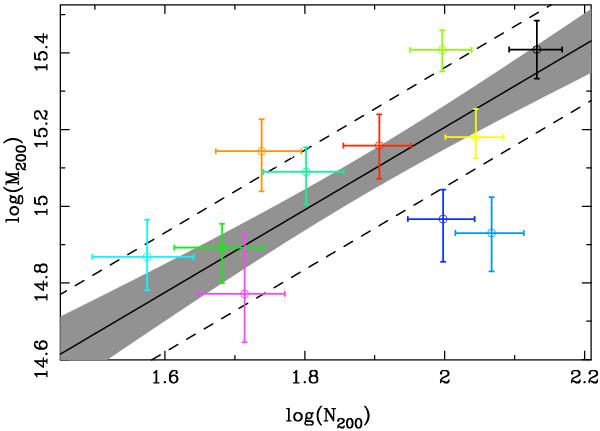
Mass-richness scaling relation calibrated with the NFW lensing masses M200. The black line shows the best BCES orthogonal fit. The region limited by the two dashed lines corresponds to the intrinsic dispersion of the galaxy clusters around the best fit. The shaded area gives the statistical 1σ uncertainty given by the best fit parameters.
Current usage metrics show cumulative count of Article Views (full-text article views including HTML views, PDF and ePub downloads, according to the available data) and Abstracts Views on Vision4Press platform.
Data correspond to usage on the plateform after 2015. The current usage metrics is available 48-96 hours after online publication and is updated daily on week days.
Initial download of the metrics may take a while.