Fig. 2
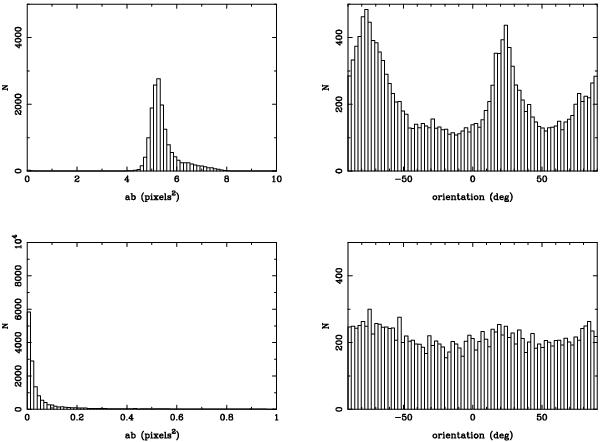
Distribution of the area (left) and orientation (right) of the stars selected in the field of RX J2228.5+2036. The top panels represent the stars before the PSF deconvolution by Im2shape, while the bottom panels show the distribution after deconvolution, with an average size close to point like objects and a uniform orientation of the stars.
Current usage metrics show cumulative count of Article Views (full-text article views including HTML views, PDF and ePub downloads, according to the available data) and Abstracts Views on Vision4Press platform.
Data correspond to usage on the plateform after 2015. The current usage metrics is available 48-96 hours after online publication and is updated daily on week days.
Initial download of the metrics may take a while.