Fig. 1
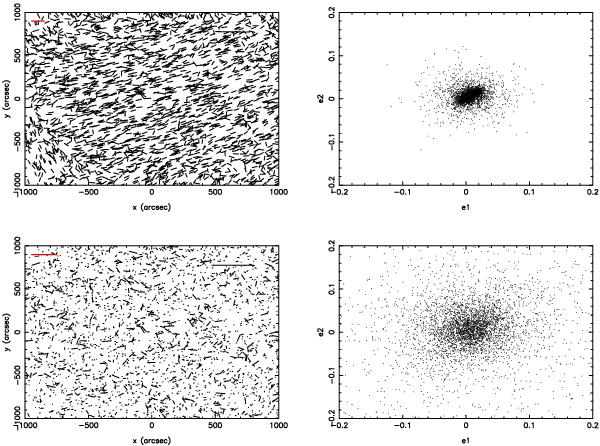
PSF treatment applied to stars: in the top-left panel we show the stars ellipticity before the Im2shape deconvolution. The corresponding distribution in terms of ellipticity components (e1, e2) is shown in the top-right panel. Bottom-left panel shows the stars after the deconvolution by the PSF field (see text), and the bottom-right panel the corresponding distribution of (e1, e2), which is more uniformly distributed than before the deconvolution. Both left panels shows in red the scale corrsponding to a semimajor axis of 1′′.
Current usage metrics show cumulative count of Article Views (full-text article views including HTML views, PDF and ePub downloads, according to the available data) and Abstracts Views on Vision4Press platform.
Data correspond to usage on the plateform after 2015. The current usage metrics is available 48-96 hours after online publication and is updated daily on week days.
Initial download of the metrics may take a while.