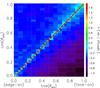
Fig. 9
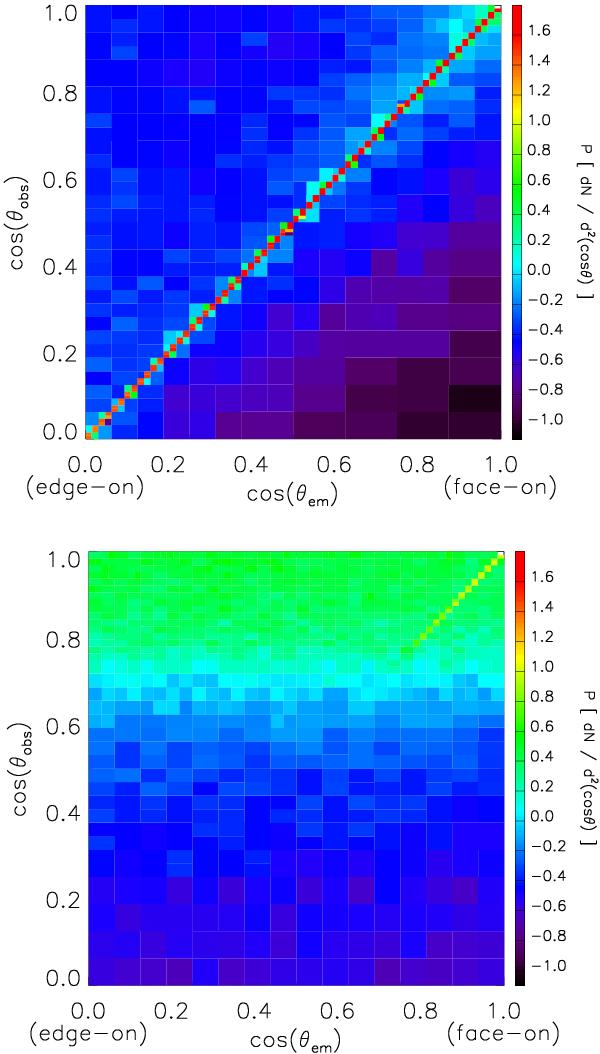
Angular redistribution of continuum (top panel) and line (bottom panel) photons. The x-axis gives the emission direction (as the cosine of the inclination angle), and the y-axis gives the direction along which the photons escape. The color-coding scales logarithmically with the number of photon per unit area in the plot, as indicated by the color tables. The white lines on both panels, show the escape fraction as a function of the emission direction.
Current usage metrics show cumulative count of Article Views (full-text article views including HTML views, PDF and ePub downloads, according to the available data) and Abstracts Views on Vision4Press platform.
Data correspond to usage on the plateform after 2015. The current usage metrics is available 48-96 hours after online publication and is updated daily on week days.
Initial download of the metrics may take a while.