Fig. 8
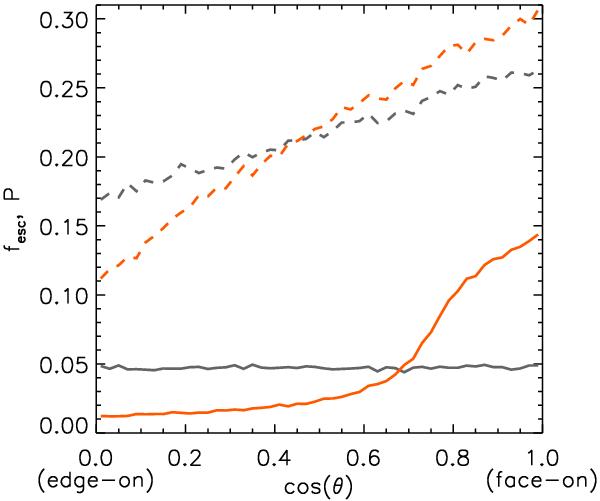
Comparison between the distributions of escape directions in orange and emission directions in gray, for line (solid lines) and continuum (dashed lines) escaping photons. See the text for a detailed explanation of the shapes of these distributions. The y axis has two different meanings, fesc for the distribution of emission directions, and P for the normalized distribution of escape directions.
Current usage metrics show cumulative count of Article Views (full-text article views including HTML views, PDF and ePub downloads, according to the available data) and Abstracts Views on Vision4Press platform.
Data correspond to usage on the plateform after 2015. The current usage metrics is available 48-96 hours after online publication and is updated daily on week days.
Initial download of the metrics may take a while.