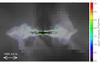
Fig. 6
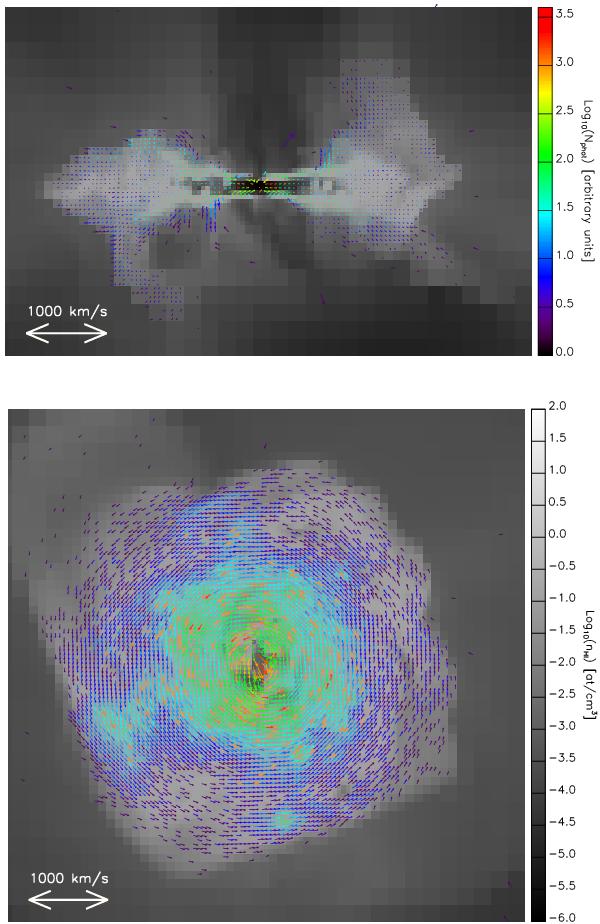
Edge-on (top) and face-on (bottom) views of G1. In both panels, the gray scale indicates the density of neutral hydrogen (maximum value in a slice of thickness 8 high-resolution cells). The arrows indicate the velocity field of the gas at the location where photons last scatter before they are observed (the double sided arrow in the bottom left corner of each panel gives the scale), and their color scales with the log10 of the number of photons seen from each cell (red: lots of photons; blue: small number of photons).
Current usage metrics show cumulative count of Article Views (full-text article views including HTML views, PDF and ePub downloads, according to the available data) and Abstracts Views on Vision4Press platform.
Data correspond to usage on the plateform after 2015. The current usage metrics is available 48-96 hours after online publication and is updated daily on week days.
Initial download of the metrics may take a while.