Fig. 3
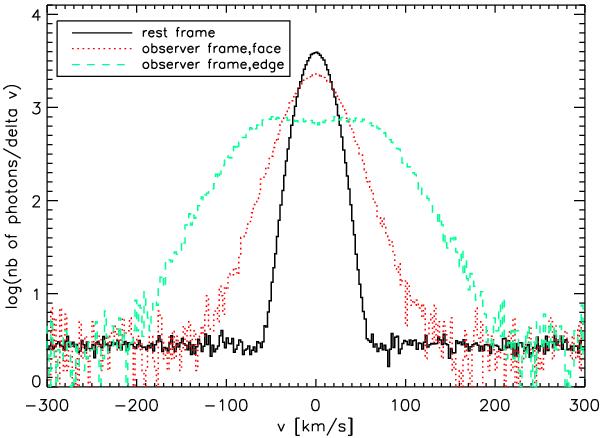
Number of photons emitted per unit velocity bin. The black histogram shows the frequency distribution in the sources frame, as sampled by all photons used in our G2 experiment. This line profile is the one we use as a model for Hii regions (Sect. 3.4). The dotted red (resp. dashed blue) histograms show how these photons are distributed in the observer frame when the galaxy is seen face-on (resp. edge-on).
Current usage metrics show cumulative count of Article Views (full-text article views including HTML views, PDF and ePub downloads, according to the available data) and Abstracts Views on Vision4Press platform.
Data correspond to usage on the plateform after 2015. The current usage metrics is available 48-96 hours after online publication and is updated daily on week days.
Initial download of the metrics may take a while.