Fig. 9
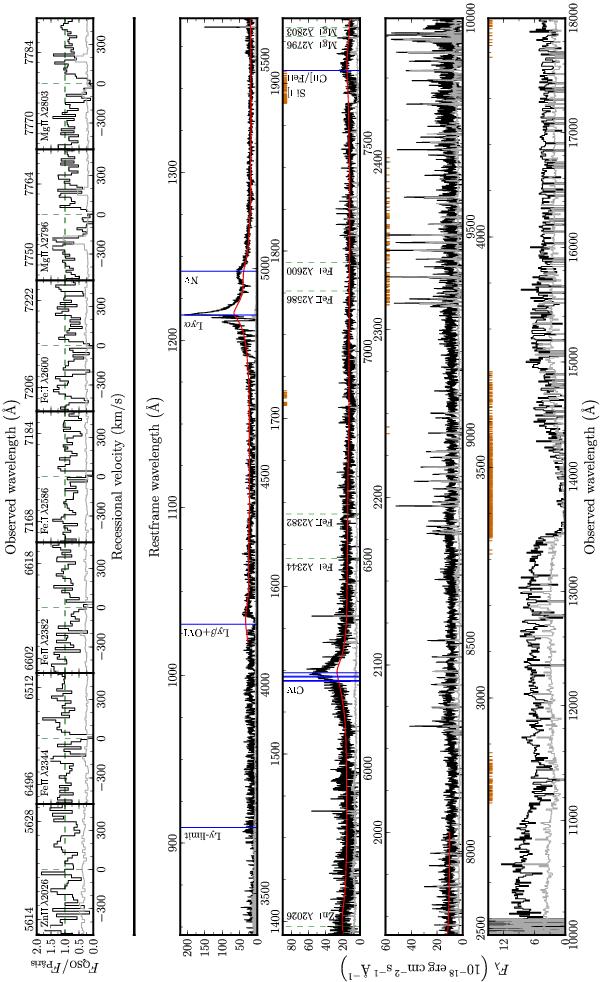
X-shooter spectrum of QSO J1408-0346 (bottom). The spectrum beyond 1.8 μm is not shown due to uncertainty in the flux calibration. The observed and rest-frame wavelengths are shown below and above each panel, respectively. The error spectrum is shown in grey. Regions of strong telluric features (atmosphere transparency <20%) were not used in the spectral analysis and are marked by small boxes at the top of each panel (NIR: Gemini observatory). The red line is the average z = 3 QSOs spectrum taken from Pâris et al. (2011). Prominent absorption and emission lines from the quasar are indicated by vertical solid lines, and the absorption lines from the strong Mg ii absorber at z = 1.77425 by vertical dashed lines (see Table 8). Zoom-ins on the absorption lines of the Mg ii absorber are shown in the top panel. They were normalised with the QSO composite spectrum.
Current usage metrics show cumulative count of Article Views (full-text article views including HTML views, PDF and ePub downloads, according to the available data) and Abstracts Views on Vision4Press platform.
Data correspond to usage on the plateform after 2015. The current usage metrics is available 48-96 hours after online publication and is updated daily on week days.
Initial download of the metrics may take a while.