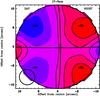
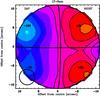
Fig. 8
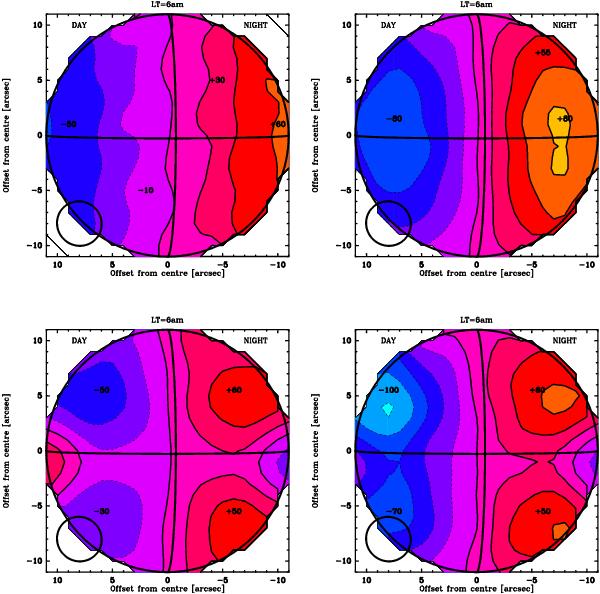
Maps of synthetic Doppler shifts (in m/s), computed assuming different wind models. In each panel, Venus’ disk is represented by the centered circle, the synthesized beam by the ellipse in the bottom left hand corner, and the terminator by the vertical arc. The contour step corresponds to 20 m/s. The Fourier-plane coverage of June 12, 2009, was used to simulate the observations. Top-left panel: prograde zonal wind model with Veq = 69 m/s. Top-right panel: Bougher et al. (1986) SSAS wind model with Vter = 200 m/s. Bottom-left panel: Bougher et al. (1986) SSAS wind model with Vter = 200 m/s, combined with a Veq = 100 m/s RSZ wind, localized in an equatorial band. Bottom-right panel: same model as in bottom-left panel, but with a modified SSAS wind velocity field in the day-side varying as  , where sza is the local solar zenith angle (solar incidence).
Current usage metrics show cumulative count of Article Views (full-text article views including HTML views, PDF and ePub downloads, according to the available data) and Abstracts Views on Vision4Press platform.
Data correspond to usage on the plateform after 2015. The current usage metrics is available 48-96 hours after online publication and is updated daily on week days.
Initial download of the metrics may take a while.