Fig. 4
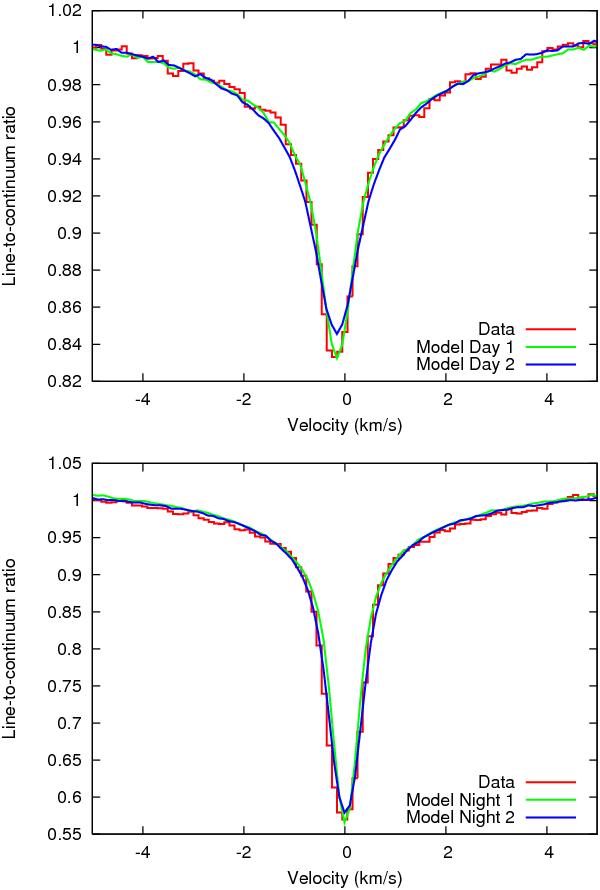
CO(1–0) lines measured on June 12, 2009, plotted against synthetic lines computed assuming adjusted atmospheric models. Model 1 (for day and night conditions) corresponds to a model where only the temperature profile is adjusted, while the CO mixing profile is fixed to the reference profile. Model 2 (for day and night conditions) corresponds to a model where only the CO mixing profile is adjusted, while the temperature profile is fixed to the reference profile. Top: day-side spectra measured on the equator at 8′′ from the sub-earth point (9.3 am local time). Bottom: night-side spectra measured on the equator at 8′′ from the sub-earth point (3.1 am local time).
Current usage metrics show cumulative count of Article Views (full-text article views including HTML views, PDF and ePub downloads, according to the available data) and Abstracts Views on Vision4Press platform.
Data correspond to usage on the plateform after 2015. The current usage metrics is available 48-96 hours after online publication and is updated daily on week days.
Initial download of the metrics may take a while.