Fig. 3
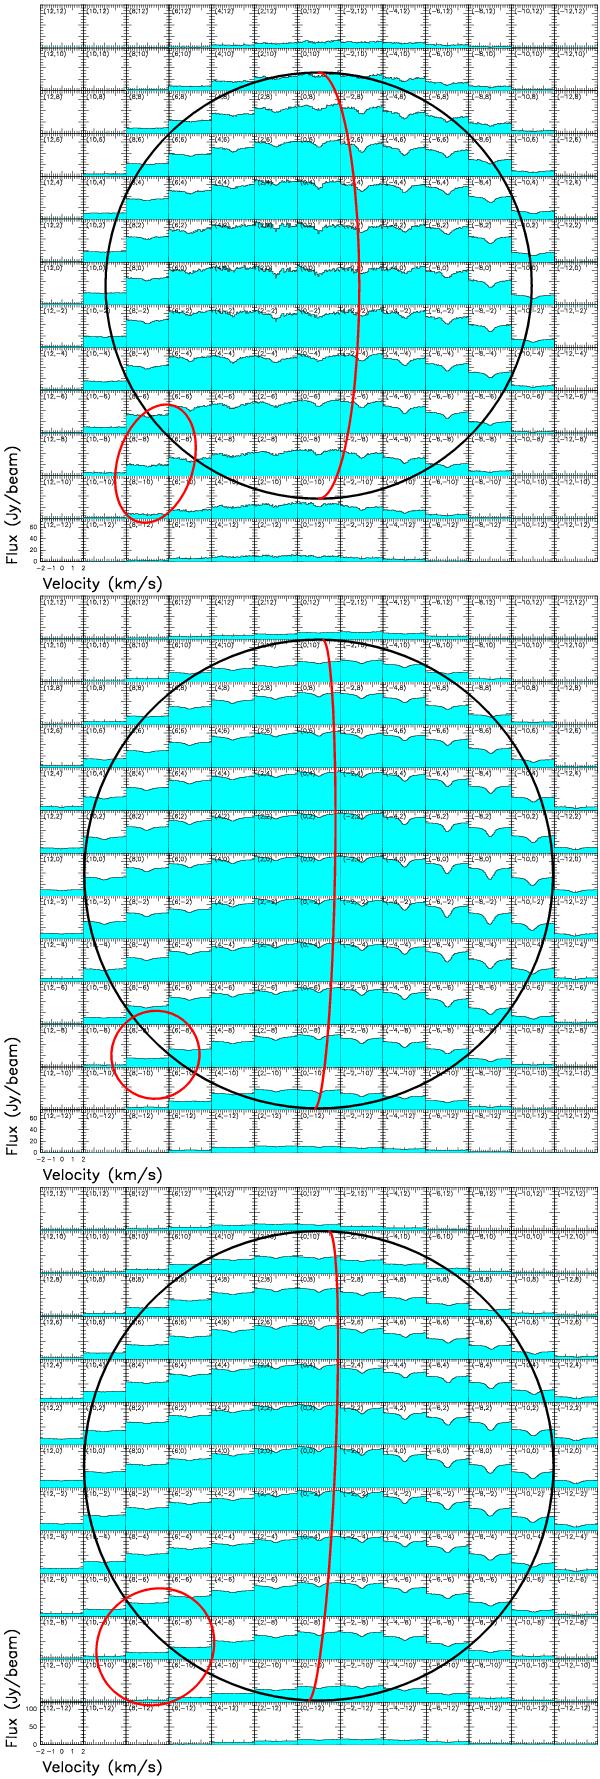
Maps of Venus’ CO(1–0) spectra (in Jy/beam), for different observing dates. The location of each spectrum with respect to the disk center is indicated in parenthesis (in arcseconds). The velocity scale for each individual spectrum goes from −2 to + 2 km s-1. The continuum level is represented by the blue background. In each panel, Venus’ disk is represented by the centered circle, the synthesized beam by the ellipse in the bottom left hand corner, and the terminator by the vertical arc. The maps were rotated so that the pole axis is vertical in the figure. Top panel: 2007 observations (merged data from the two observing dates). The flux scale goes from 0 to 75 Jy/beam. Middle panel: June 12, 2009 observations. The flux scale goes from 0 to 75 Jy/beam. Bottom panel: June 13, 2009 observations. The flux scale goes from 0 to 120 Jy/beam.
Current usage metrics show cumulative count of Article Views (full-text article views including HTML views, PDF and ePub downloads, according to the available data) and Abstracts Views on Vision4Press platform.
Data correspond to usage on the plateform after 2015. The current usage metrics is available 48-96 hours after online publication and is updated daily on week days.
Initial download of the metrics may take a while.