Fig. 2
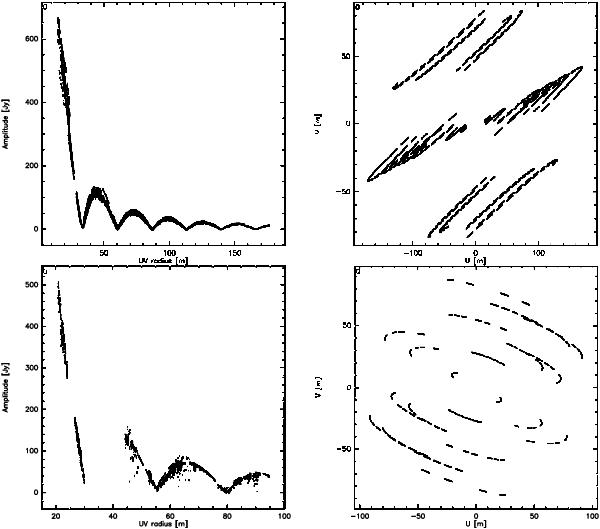
Continuum visibilities obtained in November 2007 (top panels, merged data from the two observing dates) and June 2009 (bottom panels, data from June 13). Left panels: amplitude (in Jy) of the visibilities, plotted against projected baseline length (in meters). Right panels: corresponding Fourier-plane coverage. The units correspond to the component of the projected baselines in the east-west (U) and north-south (V) directions (in m).
Current usage metrics show cumulative count of Article Views (full-text article views including HTML views, PDF and ePub downloads, according to the available data) and Abstracts Views on Vision4Press platform.
Data correspond to usage on the plateform after 2015. The current usage metrics is available 48-96 hours after online publication and is updated daily on week days.
Initial download of the metrics may take a while.