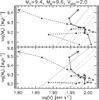
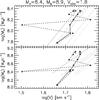
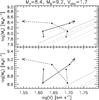
Fig. 9
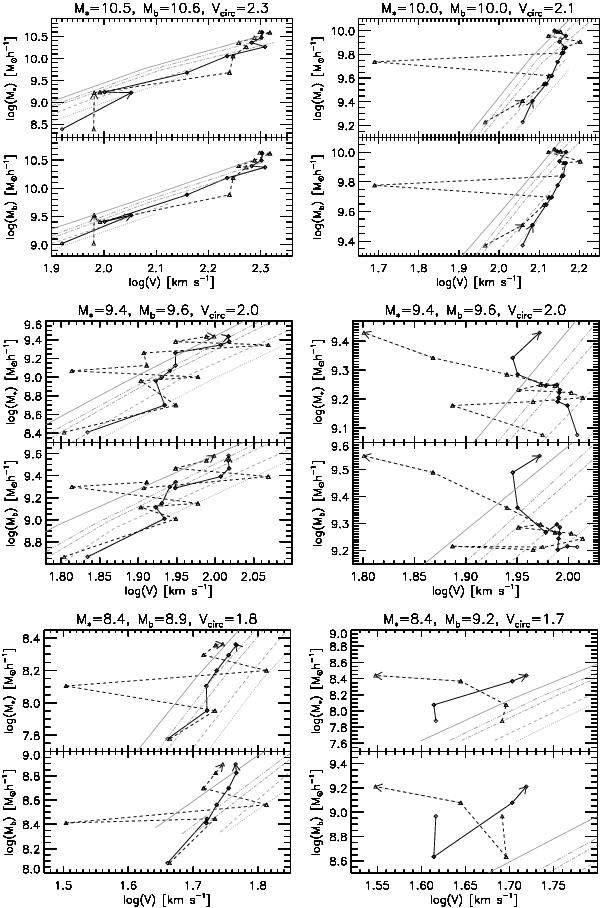
Evolutionary tracks of the six galaxies shown in Fig. 8 on the sTFR and bTFR planes. The background grey lines depict the mean sTFR and bTFR obtained by using Vcirc at Rbar as a kinematical indicator at z = 3,2,1,0.4,0 (dotted, dashed, dot-dashed, triple-dot-dashed, solid line, respectively). The black lines indicate the track of the given galaxy on the TFR plane by using Vcirc (solid line) and Vrot (dashed line) at Rbar as the kinematical indicators. In each panel, there is an arrow indicating in which direction the galaxy evolves along each path.
Current usage metrics show cumulative count of Article Views (full-text article views including HTML views, PDF and ePub downloads, according to the available data) and Abstracts Views on Vision4Press platform.
Data correspond to usage on the plateform after 2015. The current usage metrics is available 48-96 hours after online publication and is updated daily on week days.
Initial download of the metrics may take a while.