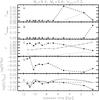
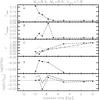
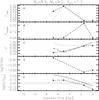
Fig. 8
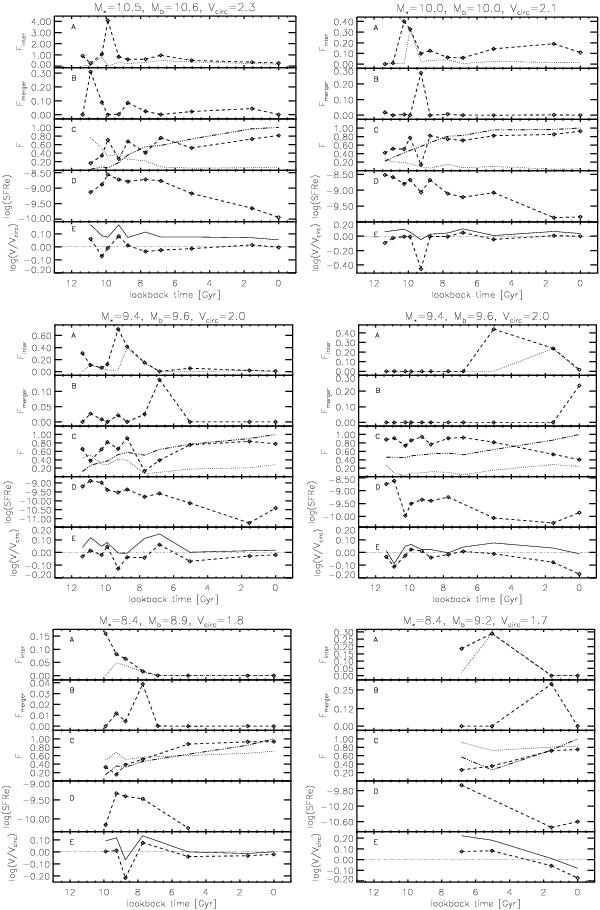
Formation histories for six typical simulated galaxies at z = 0 in the simulations, with different stellar (M∗) and baryonic (Mb) masses and circular velocities (Vcirc). The masses are given in logarithm and in units of M⊙ h-1. The circular velocities are given in logarithm and in units of km s-1. In each panel, we show the evolution of  (dotted line) and
  (dashed line) in box A. In box B, we can appreciate Fmerger. Box C shows the time evolution of the gas fraction (dotted line), baryonic mass relative to the final one (triple-dot-dashed line) and
  (dashed line). Box D shows the star formation efficiency SFRe in yr-1 and, in box E, we can appreciate the ratio Vrot/Vcirc (dashed lines) and s1.0/Vcirc (solid lines) evaluated at Rbar. See text for definitions of variables.
Current usage metrics show cumulative count of Article Views (full-text article views including HTML views, PDF and ePub downloads, according to the available data) and Abstracts Views on Vision4Press platform.
Data correspond to usage on the plateform after 2015. The current usage metrics is available 48-96 hours after online publication and is updated daily on week days.
Initial download of the metrics may take a while.