Fig. 7
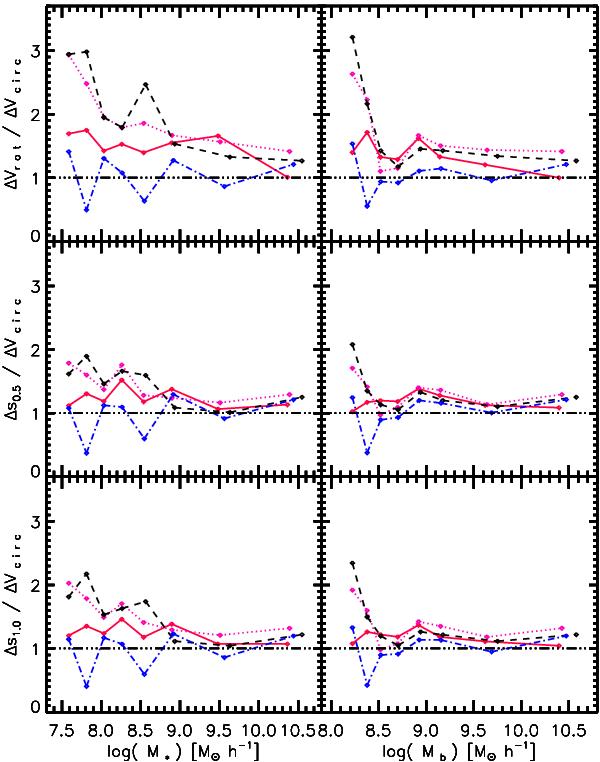
Ratio between the standard deviations of Vi and Vcirc (ΔVi/ΔVcirc) at z = 0 for different bins of stellar (M∗) and baryonic (Mb) mass. Each bin is constituted by 35 galaxies of similar stellar or baryonic masses. Results are shown for Vi: Vrot (upper panels), s0.5 (middle panels) and s1.0 (lower panels). The kinematical indicators are estimated by evaluating the gas kinematics at different radii in the simulations: Rmax (dot-dashed line), 0.5 Rbar (solid line), Rbar (dotted line) and 1.5 Rbar (dashed line).
Current usage metrics show cumulative count of Article Views (full-text article views including HTML views, PDF and ePub downloads, according to the available data) and Abstracts Views on Vision4Press platform.
Data correspond to usage on the plateform after 2015. The current usage metrics is available 48-96 hours after online publication and is updated daily on week days.
Initial download of the metrics may take a while.