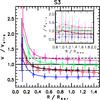
Fig. 6
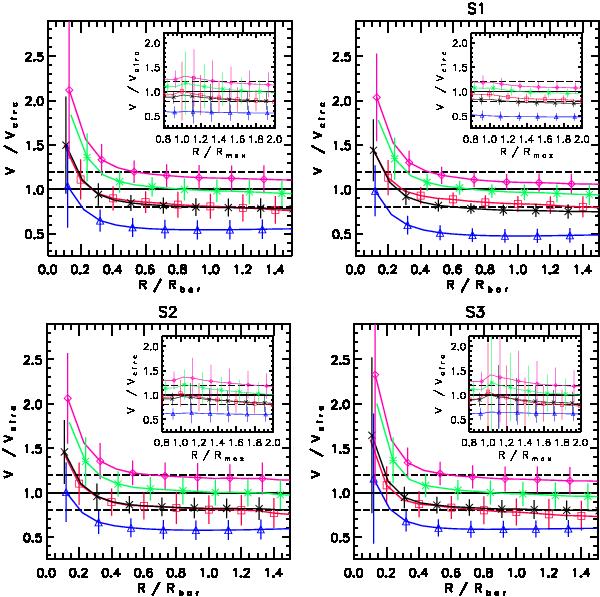
Vi/Vcirc at z = 0 as a function of radius in the simulations for Vi: σ (blue triangles), Vrot (red squares), s0.5 (black crosses), s1.0 (green asterisks) and S (pink diamonds). Each symbol represents the averaged value over the entire sample of galaxies (upper left panel) and the subsamples S1, S2 and S3 defined in Sect. 2.2 (upper right panel, lower left panel and lower right panel, respectively). The corresponding standard deviations are also shown. The radii are given normalised to Rbar in the main panels while in the insets, they are given normalised to Rmax. The horizontal solid line indicates where Vi agrees with Vcirc, while the dashed horizontal lines denote the range where Vi does not depart more than 20% from Vcirc.
Current usage metrics show cumulative count of Article Views (full-text article views including HTML views, PDF and ePub downloads, according to the available data) and Abstracts Views on Vision4Press platform.
Data correspond to usage on the plateform after 2015. The current usage metrics is available 48-96 hours after online publication and is updated daily on week days.
Initial download of the metrics may take a while.