Fig. 3
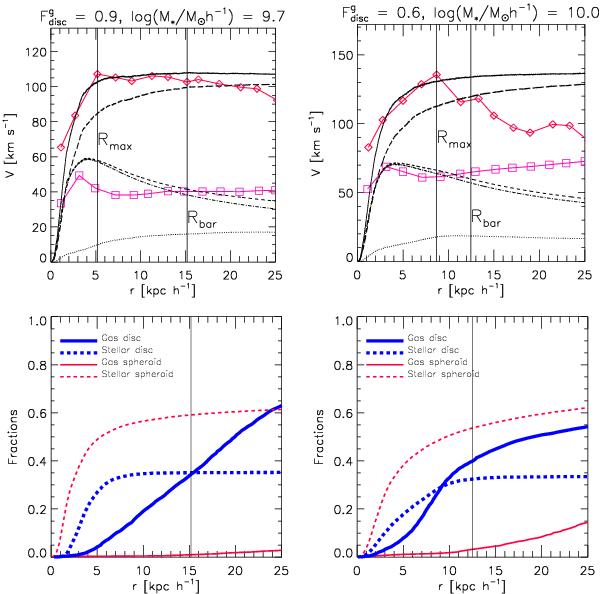
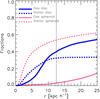
Upper panels: rotation curves for two typical simulated galaxies G1 and G2 (left and right panels, respectively) at z = 0 with different fractions of gas supported by rotation ( ). The total circular velocity is shown with a solid line. The circular velocities contributed by the gas, stellar, baryonic and dark components are represented with dotted, dot-dashed, dashed and long-dashed lines, respectively. The mean rotation curve (diamonds) and the mean dispersion velocity curve (squares) for the gas-phase are also plotted. The vertical lines indicate the baryonic radius (Rbar) and the radius where the mean rotation velocity reaches a maximum value (Rmax). Lower panels: gas (solid lines) and stellar (dashed lines) mass in the spheroidal (red) and disc (blue) components as a function of radius, normalised to the corresponding total gas or stellar mass within 3 Rbar. The vertical line depicts Rbar.
Current usage metrics show cumulative count of Article Views (full-text article views including HTML views, PDF and ePub downloads, according to the available data) and Abstracts Views on Vision4Press platform.
Data correspond to usage on the plateform after 2015. The current usage metrics is available 48-96 hours after online publication and is updated daily on week days.
Initial download of the metrics may take a while.