Fig. 2
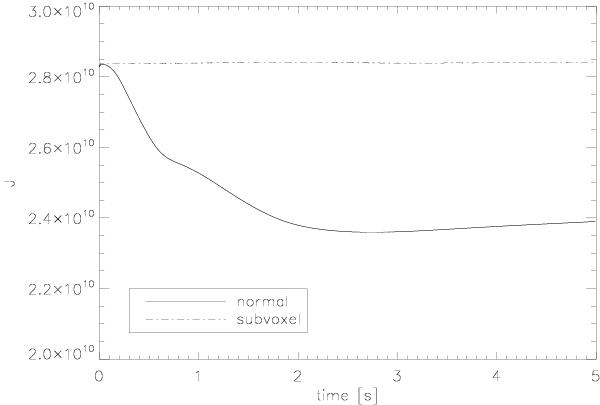
Demonstration of numerical errors. The solid line shows the mean intensity of one outermost voxel for a method that tracks the intensity time derivatives by averaging over a voxel. The mean intensity is inaccurate and then relaxes to the wrong solution. The dot-dashed line shows the results of the subvoxel method, which is numerically much more accurate.
Current usage metrics show cumulative count of Article Views (full-text article views including HTML views, PDF and ePub downloads, according to the available data) and Abstracts Views on Vision4Press platform.
Data correspond to usage on the plateform after 2015. The current usage metrics is available 48-96 hours after online publication and is updated daily on week days.
Initial download of the metrics may take a while.