Open Access
Fig. 5
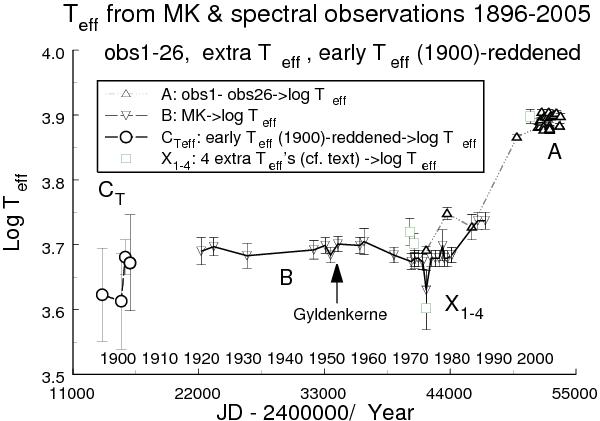
Temperatures from Teff observations (“A”), from MK values transformed to Teff (“B”), from extra data (“X”) and from temperature correlation data (“CT)” form the base time-line of this study (step 1). For the meaning of the letters A–F, X we refer to the text.
Current usage metrics show cumulative count of Article Views (full-text article views including HTML views, PDF and ePub downloads, according to the available data) and Abstracts Views on Vision4Press platform.
Data correspond to usage on the plateform after 2015. The current usage metrics is available 48-96 hours after online publication and is updated daily on week days.
Initial download of the metrics may take a while.