Fig. 12
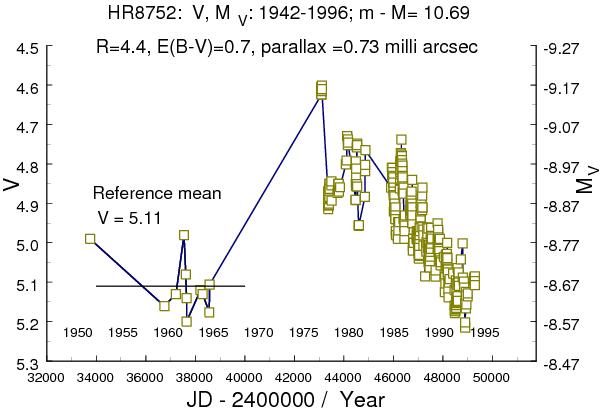
The visual observed resp. absolute magnitudes mV and MV are given for the timeframe 1942–1996 as one plot with two ordinate values. The absolute visual magnitude is given as “unreddened” MV = V − AV − (m − M), for AV = R × E(B − V) with the observed values of R and E(B − V). The mean value of V for 1919–1973 appears to cluster around a value near V = 5.1 and is indicated by a line at the left lower side of the figure.
Current usage metrics show cumulative count of Article Views (full-text article views including HTML views, PDF and ePub downloads, according to the available data) and Abstracts Views on Vision4Press platform.
Data correspond to usage on the plateform after 2015. The current usage metrics is available 48-96 hours after online publication and is updated daily on week days.
Initial download of the metrics may take a while.