Free Access
Fig. 1
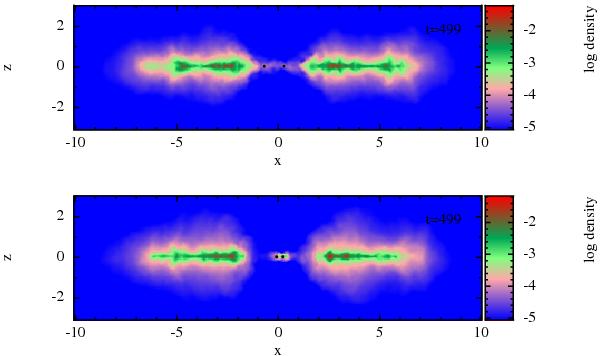
Relaxed meridional density maps of the disc for the adia (top) and iso (bottom) runs; the black dots indicate the BHs, the axis are in units of the binary semi-major axis a. Note that this is not an azimuthal average but a vertical slice of the disc.
This figure is made of several images, please see below:
Current usage metrics show cumulative count of Article Views (full-text article views including HTML views, PDF and ePub downloads, according to the available data) and Abstracts Views on Vision4Press platform.
Data correspond to usage on the plateform after 2015. The current usage metrics is available 48-96 hours after online publication and is updated daily on week days.
Initial download of the metrics may take a while.