Fig. 2
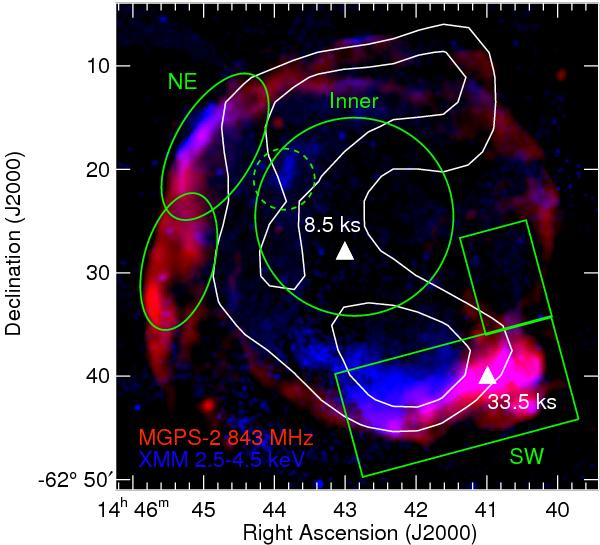
Composite radio (MGPS-2 at 843 MHz, Murphy et al. 2007, in red) and X-ray (XMM-Newton/MOS in the 2.5–4.5 keV band, in blue) image of RCW 86. The XMM-Newton/MOS image has been smoothed with a Gaussian of width 10′′. H.E.S.S. contours (Aharonian et al. 2009) are overlaid in white, as in Fig. 1. Triangles mark the RXTE pointing positions with the associated exposure times. The different ASCA/GIS regions for spectral extraction are delineated in green and labeled NE, SW and Inner (counts within the dashed circle were excluded), as in Bamba et al. (2000).
Current usage metrics show cumulative count of Article Views (full-text article views including HTML views, PDF and ePub downloads, according to the available data) and Abstracts Views on Vision4Press platform.
Data correspond to usage on the plateform after 2015. The current usage metrics is available 48-96 hours after online publication and is updated daily on week days.
Initial download of the metrics may take a while.