Fig. 1
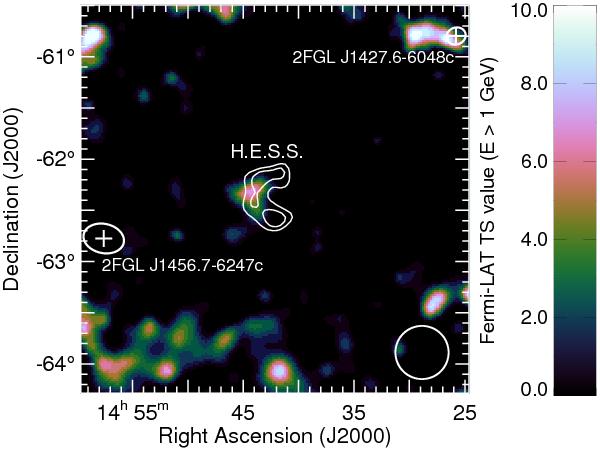
Fermi-LAT test statistic (TS) map towards RCW 86, above 1 GeV. The TS was evaluated by placing a point-source at the center of each pixel, Galactic diffuse emission and nearby 2FGL sources being included in the background model. H.E.S.S. contours (Aharonian et al. 2009) are overlaid as white solid lines, and the white circle indicates the size of the 68% containment region of the LAT PSF at 10 GeV. Crosses and ellipses mark the best-fit positions and associated errors of the two sources from the 2FGL Fermi-LAT catalog (Nolan et al. 2012) within 4° from RCW 86.
Current usage metrics show cumulative count of Article Views (full-text article views including HTML views, PDF and ePub downloads, according to the available data) and Abstracts Views on Vision4Press platform.
Data correspond to usage on the plateform after 2015. The current usage metrics is available 48-96 hours after online publication and is updated daily on week days.
Initial download of the metrics may take a while.