Fig. 3
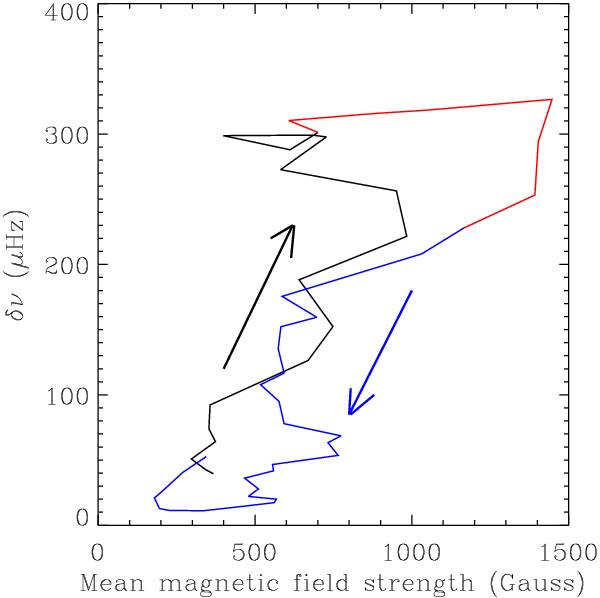
Averaged p-mode frequency shifts, δν, plotted as a function of the mean magnetic field strength calculated from STARA. The black, red, and blue colours indicate the ascending, maximum, and descending phases of solar cycle 23, respectively. The arrows indicate the direction of time.
Current usage metrics show cumulative count of Article Views (full-text article views including HTML views, PDF and ePub downloads, according to the available data) and Abstracts Views on Vision4Press platform.
Data correspond to usage on the plateform after 2015. The current usage metrics is available 48-96 hours after online publication and is updated daily on week days.
Initial download of the metrics may take a while.