| Issue |
A&A
Volume 545, September 2012
|
|
|---|---|---|
| Article Number | A30 | |
| Number of page(s) | 9 | |
| Section | Stellar atmospheres | |
| DOI | https://doi.org/10.1051/0004-6361/201219829 | |
| Published online | 31 August 2012 | |
On the incidence of weak magnetic fields in DA white dwarfs⋆,⋆⋆
1
Armagh Observatory,
College Hill, Armagh, BT61 9DG,
Northern Ireland,
UK
e-mail: This email address is being protected from spambots. You need JavaScript enabled to view it.
2
Department of Physics and Astronomy, The University of Western
Ontario, London,
Ontario, N6A 3K7, Canada
e-mail: This email address is being protected from spambots. You need JavaScript enabled to view it.
3
Special Astrophysical Observatory, Nizhnij Arkhyz, Zelenchukskiy Region,
369167
Karachai-Cherkessian Republic,
Russia
e-mail: This email address is being protected from spambots. You need JavaScript enabled to view it.
4
Argelander-Institut für Astronomie der Universität Bonn,
Auf dem Hügel 71,
53121
Bonn,
Germany
e-mail: This email address is being protected from spambots. You need JavaScript enabled to view it.
5
Astronomisches Rechen-Institut, Zentrum für Astronomie der
Universität Heidelberg, Mönchhofstr. 12-14, 69120
Heidelberg,
Germany
e-mail: This email address is being protected from spambots. You need JavaScript enabled to view it.
6
Dominion Astrophysical Observatory, Herzberg Institute of
Astrophysics, National Research
Council of Canada, 5071 West Saanich Road, Victoria, BC
V9E 2E7,
Canada
e-mail: This email address is being protected from spambots. You need JavaScript enabled to view it.
7
Department of Physics, Royal Military College of Canada, PO Box 17000, Stn Forces,
Kingston, Ontario
K7K 7B4,
Canada
e-mail: This email address is being protected from spambots. You need JavaScript enabled to view it.
Received:
17
June
2012
Accepted:
29
July
2012
Abstract
Context. About 10% of white dwarfs have magnetic fields with strength in the range between about 105 and 5 × 10⁸ G. It is not known whether the remaining white dwarfs are not magnetic, or if they have magnetic fields too weak to be detected with the techniques adopted in the large surveys. Information is particularly lacking for the cooler (and generally fainter) white dwarfs.
Aims. We describe the results of the first survey specifically devised to clarify the detection frequency of kG-level magnetic fields in cool DA white dwarfs.
Methods. Using the FORS1 instrument of the ESO VLT, we have obtained Balmer line circular spectropolarimetric measurements of a small sample of cool (DA6 – DA8) white dwarfs. Using FORS and UVES archive data, we have also revised numerous white dwarf field measurements previously published in the literature.
Results. We have discovered an apparently constant longitudinal magnetic field of ~9.5 kG in the DA6 white dwarf WD 2105−820. This star is the first weak-field white dwarf that has been observed sufficiently to roughly determine the characteristics of its field. The available data are consistent with a simple dipolar morphology with magnetic axis nearly parallel to the rotation axis, and a polar strength of ≃ 56 kG. Our re-evaluation of the FORS archive data for white dwarfs indicates that longitudinal magnetic fields weaker than 10 kG have previously been correctly identified in at least three white dwarfs. However, for one of these three weak-field stars (WD 2359−434), UVES archive data show a ~100 kG mean field modulus. Either at the time of the FORS observations the star’s magnetic field axis was nearly perpendicular to the line of sight, or the star’s magnetic field has rather complex structure.
Conclusions. We find that the probability of detecting a field of kG strength in a DA white dwarf is of the order of 10% for each of the cool and hot DA stars. If there is a lower cutoff to field strength in white dwarfs, or a field below which all white dwarfs are magnetic, the current precision of measurements is not yet sufficient to reveal it.
Key words: white dwarfs / stars: magnetic field
Based on observations collected at the European Organisation for Astronomical Research in the Southern Hemisphere, Chile, under observing programme 073.D-0516, and obtained from the ESO/ST-ECF Science Archive Facility.
Table 3 is available in electronic form at http://www.aanda.org
© ESO, 2012
1. Introduction
In 1970, a magnetic field was discovered in the peculiar white dwarf (WD) Grw + 70 8247 = GJ 472 (Kemp et al. 1970). The field strength was eventually estimated to be of the order of 300 MG (Greenstein 1984; Wickramasinghe & Ferrario 1988; Jordan 1992). Since this first detection of a magnetic field in a degenerate star, about 200 magnetic white dwarfs (MWDs) have been discovered (Kawka et al. 2007; Külebi et al. 2009b). It is found that about 10% of all single WDs have a magnetic field with a strength in the range between hundreds of kG and hundreds of MG.
It is not at all clear how the magnetic fields in WDs originate, nor what information they carry about the origin and evolution of magnetism during stellar evolution. It is also not very clear yet how these fields influence such phenomena as rotation periods or pulsation of white dwarfs. Clearly, a broad observational base of data is essential for understanding these issues.
The magnetic fields of WDs are sometimes variable with the stellar rotation period, which when measurable is typically of the order of hours or days (e.g. Kawka et al. 2007). It appears that MWDs may often be somewhat more massive than the overall WD average mass of about 0.6 M⊙ (Liebert 1988), although fields are occasionally found in relatively low-mass WDs. Most of the fields known are in WDs of spectral type DA, a white dwarf classification indicating that the optical spectrum shows only spectral lines of hydrogen, and which generally identifies WDs with H-rich atmospheres. This is at least partly a selection effect due to the fact that the strong and sharp Balmer lines are particularly sensitive probes of stellar magnetism, which in many cases can be easily detected in low-dispersion spectra from surveys such as the Sloan Digital Sky Survey (Külebi et al. 2009a,b).
The concentration of WD magnetic field strengths as a function of log ⟨ | B | ⟩ (Külebi et al. 2009b) in the best-studied range of 1–100 MG has raised the question of whether there is a cutoff field strength below which white dwarf fields do not occur (as is the case for Ap stars, Aurière et al. 2007), or whether the probability of detecting a field might rise sharply below a field strength of some tens of kG. Resolving this question confronts the difficulty of detecting weak fields in such faint, broad-lined objects, and our current knowledge of the low-field tail of the white dwarf field strength distribution is limited mainly by instrumental constraints. It is very difficult to obtain field measurements with standard errors of less that about 10 kG without using the largest available telescopes (see e.g. Valyavin et al. 2006; Kawka et al. 2007). However, the study of available statistics by Liebert et al. (2003) and the survey by Aznar Cuadrado et al. (2004) both suggest that the detection rate for fields weaker than a few tens of kG may be significantly higher than the frequency of ~10%, which characterises the overall detection rate of stronger fields.
A further question of great interest is whether the magnetic fields of WDs evolve with time, and if so, how they evolve. The searches for kG fields reported so far (Aznar Cuadrado et al. 2004; Valyavin et al. 2006; Kawka et al. 2007; Jordan et al. 2007) have focussed almost entirely on the generally brighter hotter (and therefore younger) white dwarfs. It is thus worthwhile to focus a survey on cooler and older white dwarfs, and the higher detection probability predicted by earlier work suggests that even a fairly small sample of such stars may yield interesting results.
Thus, to increase the available information about the incidence of weak fields, and to extend this information to include some older, cooler white dwarfs, we have carried out a modest survey for fields in DA WDs with effective temperatures Teff below about 14 000 K, aiming at obtaining field measurements with ~ 1 kG error bars.
Recent work by Bagnulo et al. (2012), Jordan et al. (2012), and Landstreet et al. (2012) have shown that the results of some FORS1 surveys of magnetic fields in various classes of stars were affected by spurious detections, highlighting the need for a re-analysis of published data for MWDs. Therefore, we have complemented the results of our own survey with the revision of all FORS1 field measurements of WDs.
2. New observations
White dwarfs with very strong fields can be identified via broad-band circular polarimetry, as magnetic fields may produce circular polarization of the continuum radiation at the level of 1 to a few% for fields of 10 MG or more. However, most MWDs have been detected by observing the Zeeman effect in the Stokes I and/or V profiles of spectral lines.
For a 100 kG magnetic field, the π − σ separation produced by the Zeeman effect in optical spectral lines is ~1 Å. For DA WDs, this is of the same order as the pressure broadening of the Balmer line cores (Koester et al. 1998). This sets a lower limit to the strength of the field that can be detected through intensity measurements, since for a field strength ≲ 30 kG, Zeeman splitting no longer dominates over pressure broadening, and weak splitting is difficult to distinguish from rotational line broadening. Practically, most past surveys could firmly detect only fields with ⟨ | B | ⟩ ≳ 50−100 kG, as at lower field strength the Zeeman splitting in Stokes I would be beneath the resolving-power limit of the instrument, and/or swamped by noise.
In conclusion, for field with strength ≲ 50 kG, the most appropriate method for field detection is based on low-resolution, high signal-to-noise ratio (S/N) measurements of the circular polarization of spectral lines, which can be obtained with large telescopes (Landstreet 1992; Schmidt 2001). Circular spectropolarimetry of Balmer lines is the tool best suited for our field survey of DA stars.
New longitudinal magnetic field measurements obtained with FORS1.
Our circular spectropolarimetric observations (programme ID 073.D-0516) were carried out in service mode during 2004 using FORS1 on the ESO VLT telescope Antu. Our survey draws randomly on a list of nearby cool (Teff ≲ 14 000 K) WDs1. Targets were observed using grism 600B with a 1.0-arcsec slit. Our FORS spectra have a resolving power of about 830, and cover the wavelength window from 3470 to 5880 Å, thus including all the hydrogen Balmer lines from Hβ down to the series limit at about H9.
For each stellar observations, we typically obtained four integrations with the quarter-wave plate rotated by 90° between successive exposures (an observing procedure that makes it possible to eliminate a number of sources of measurement error to first order – see, e.g., Bagnulo et al. 2009). Data reduction and field measurements were performed as explained by Bagnulo et al. (2012). In particular, the mean line-of-sight magnetic field ⟨ Bz ⟩ was obtained by using the relationship  (1)(Landstreet 1982), where CZ = e / 4πmc2, as a correlation equation between the slope dI/dλ of the local spectral intensity I(λ), and the local circular polarisation V(λ), pixel by pixel, as explained in detail by Bagnulo et al. (2012). However, in computing the slope of the correlation between the value of V / I with dI / dλ, sigma clipping has now been introduced to remove outliers (mostly from cosmic rays) that add noise but no real signal. Since all of the stars observed are DA stars, real magnetic signal is only found in the H lines, and therefore field strengths were determined using only these lines. The wavelength window to use for each line of each star was set after visual inspection of the I spectrum, to include all of each line wing out to the point where the line slope decreases to typical values produced by noise in the continuum.
For each observation we have also produced a null spectrum NV, a quantity computed by combining the circular polarisation spectra from the four sub-exposures of the observation in such a way as to cancel out the the real circular polarisation signal. The value of the null spectrum is that it can reveal artefacts or systematic errors in the data (due for example to cosmic rays). In a successful observation the NV spectrum should be featureless at the level of the photon noise, and the magnetic field deduced from NV should be consistent with zero within its uncertainty. The computation and meaning of NV are discussed at length by Bagnulo et al. (2009, 2012).
The target list, observing log, and field measurments are given in Table 1, which provides: two names (Cols. 1 and 2); visual magnitude V (Col. 3); the spectral class (Col. 4); the effective temperature Teff in K and the logarithm of the gravity g in cm s-2, both taken from Lajoie & Bergeron (2007) or Koester et al. (2009); the modified Julian Date (MJD) of the midpoint of each observation (Col. 7); the total integration time tint in sec (Col. 8); the measured value of the mean longitudinal field strength ⟨ Bz ⟩ and its standard error σ ⟨ Bz ⟩ (Col. 9); and the significance of the detection, | ⟨ Bz ⟩ / σ ⟨ Bz ⟩ | . The survey comprises 15 individual measurements of eight different stars, and required about 8 h of telescope time in service mode (out of 42 h originally planned).
The observed WDs are quite faint (their magnitude ranges from V ~ 13 to ~ 16), and in some of them, the low values of Teff lead to rather weak Balmer lines. Nevertheless, it may be seen that the precision sought for these measurements has been, to a considerable extent, achieved: all but two of the 15 measurements have standard errors in the range of 800 to 2000 G.
3. Results
3.1. Detection of a kG field in WD 2105−820
Only one of the eight cool DA WDs of Table 1 shows clear evidence of a magnetic field of kG strength, namely WD 2105−820 = GJ 820.1 = LTT 8381, which is a DA6 star with Teff = 10 800 K. This star had previously been flagged by Koester et al. (1998) as potentially magnetic, on the basis of showing excess broadening (and possibly Zeeman splitting) in the core of Hα, although they point out that the observed broadening could instead be due to rapid rotation with vsini = 65 km s-1. For this star, we have five ⟨ Bz ⟩ measurements with a typical (median) standard error of about 1400 G. Our five measurements reveal a longitudinal field ⟨ Bz ⟩ ≈ + 9500 G, with a ~ 1200 G dispersion, similar to the median measurement uncertainty. The significance of the individual detections, | ⟨ Bz ⟩ / σ ⟨ Bz ⟩ | , ranges from about 5 to more than 10. Even with the problem of occasional outliers among field measurements obtained with FORS1 (see Bagnulo et al. 2012), these detections are sufficiently significant and numerous to allow us to conclude that the field is certainly present.
The I, V / I and NV spectra of one observation of WD 2105−820 are shown in Fig. 1. One can clearly see the weak S-shaped excursions around zero in V / I at the positions of several of the Balmer line cores that reveal the presence of the field of this star. Because our observations have quite low spectral resolution, we cannot detect line splitting in the I spectrum, or structure in the variation of V / I with wavelength, from which to obtain further information about field morphology.
 |
Fig. 1 Observations of WD 2105−820 obtained with FORS1 on 2004-08-10 UT 05:01 = MJD 53 227.209. The top panel shows the observed flux F (black solid line, in arbitrary units, and not corrected for the instrument response), the PV = V / I profile (red solid line centred about 0), and the null profile NV (blue solid line, offset by −2.75% for display purpose). The null profile is expected to be centred about zero and scattered according to a Gaussian with σ given by the PV error bars, which are represented with light blue bars centred about −2.75%. The regions used for field measurement are marked with green bars above and below this spectrum. The slope of the interpolating lines in the bottom panels provides the mean longitudinal field from PV (left bottom panel) and from the null profile (right bottom panel) both calculated using only the H Balmer lines. The corresponding ⟨ Bz ⟩ and ⟨ Nz ⟩ values are 9770 ± 843 G and −11 ± 868 G, respectively. |
3.2. Other results (non-detections)
White dwarfs in which weak fields may be present.
Two of the three observations of WD 2151−015 are different from zero at a little more than the 2 σ level, hence they do not represent a significant detection. However, the presence in this star of a 2−4 kG field cannot be ruled out. All the field measurements for all the remaining stars lie within 2σ of zero field.
4. A revised list of detections of weak magnetic fields in DA white dwarfs
To set the results of our survey into a broader context, we have compiled a list that includes all DA WDs in which, according to this and previous work, a measurement of a non-zero longitudinal magnetic field was obtained with an error bar σ ⟨ Bz ⟩ ≲ 2 kG.
4.1. FORS1 archive measurements of longitudinal field
The largest database of spectropolarimetric data that have reached a sufficiently high S/N to detect weak fields is that included in the FORS1 data archive. Most WD spectropolarimetric observations were obtained in the context of dedicated surveys (Aznar Cuadrado et al. 2004; Jordan et al. 2007, and this work). In addition to them, the FORS1 data archive includes also four additional spectropolarimetric observations of DA WDs that were obtained mainly for calibration purposes.
To produce a homogeneous dataset incorporating our current understanding of how best to treat FORS1 spectropolarimetry, and to examine the data to see if new reductions reveal any significant fields missed in the earlier reductions, all FORS1 measurements have been re-reduced following the same procedure adopted for the results discussed in Sect. 2 (Bagnulo et al. 2012). As discussed at length in that article, these re-reductions are expected to provide significantly improved field strengths and (especially) uncertainties compared to the initial published reductions. Our 70 “new” measurements from “old” FORS1 archive data are reported in Table 3, which is organised in a similar way as Table 1, with the omission of the V magnitude and the insertion of a new column which refers to the ESO programme ID of the observing run corresponding the the observation. Values of Teff and log g are taken from Lajoie & Bergeron (2007); Koester et al. (2009); Giammichele et al. (2012). Note that all our new field determinations from data obtained by Aznar Cuadrado et al. (2004) have the opposite sign compared to their original publication, to conform to the usual sign convention for the mean longitudinal component of a stellar magnetic field (i.e., positive when pointing to the observer).
The result of our re-evaluation of magnetic field measurements in WDs from previously published FORS1 data is to confirm detections in three stars (WD 0446−789, WD 1105−048, and WD 2359−434). Note that these detections are based on rather limited datasets. Each of these stars was observed only twice; in WD 0446−789 and WD 2359−434, a field was detected in both epochs, while in WD 1105−048 the magnetic field was detected only in one of the two observing epochs. All field detections are only at the significance level of 3 to 6σ.
On the basis of ⟨ Bz ⟩ measurements significant at the 2σ to 3σ level, possible fields detections were reported for the stars WD 1620–391, WD 2007–303, and WD 2039–202. In the new reductions, only one of these measurements remains significant at slightly more than the 2σ level. We consider that there is at present no firm evidence that any of these stars posess detected kG fields.
4.2. Other spectropolarimetric observations of weak-field WDs
A literature search for additional WDs with a ≲ 20 kG detected longitudinal magnetic field returned only two stars: WD 0413−077 = 40 Eri B (Fabrika et al. 2003), and one confirming observation for the field of WD 1105−048 (Valyavin et al. 2006).
The detection of WD 0413−077 by Fabrika et al. (2003) is based on an accumulation of measurements, most of which individually are only barely significant. Furthermore, those observations were carried out with rather old spectropolarimeters designed in the late 1970s and early 80s. For these reasons, the detection of the field in WD 0413−011 still requires confirming observations.
The confirming field detection in WD 1105−048 (Valyavin et al. 2006) was obtained within the context of a survey of five WDs (and 2 sdBs), which otherwise reported null results.
4.3. A list of white dwarfs with weak magnetic fields
The entries of Table 3, complemented with the WD targets of the survey by Valyavin et al. (2006) and the observation of WD 0413−077 by Fabrika et al. (2003), constitute a database that includes high-precision field measurements for 36 DA WDs. From Table 3 we have excluded four WDs for which ⟨ Bz ⟩ measurements were obtained with error bars substantially larger than 2 kG. The mean error bar is 0.8 kG, which corresponds to a typical (firm) field detection threshold of about 5 kG. From this database we have extracted a final list of suspected or confirmed weak-field DA WDs that satisfy the condition | ⟨ Bz ⟩ | <20 kG. This list of stars (sorted by RA) is given in Table 2, which is organised as follows. Columns 1 to 4 give star ID, spectral type, effective temperature and gravity. Column 5 contains a comment as to whether the field measurement that appeared in the original papers would correspond to firm detection (Y), or to a possible detection (P). The publications that include the original field measurements are listed in Col. 6. Column 7 shows a note reporting whether according to our re-reduction of FORS1 data of Table 3, a field was firmly (Y), possibly (P) or not (N) detected. The acronym NA (not applicable) used for 40 Eri B means that the original data were not obtained with FORS and were not re-analysed. Column 8 provides a new estimate of the range of field variation as determined from the measurements available to date, including the revisions reported in Table 3.
Table 2 shows that the newly-detected weak-field white dwarf, WD 2105−082, has been observed sufficiently often, and with sufficiently high precision to fully confirm the existence of the detected field, and to conclude that ⟨ Bz ⟩ is probably nearly constant with time. Field detection in WD 2359−434 appears reasonably secure, and the two measurements obtained so far are consistent with a field nearly constant with time. The hotter stars WD 0446−789, WD 1105−048, and 40 Eri B, appear to have variable fields.
4.4. Stokes I profiles from UVES archive data
 |
Fig. 2 Hα cores of four cool WDs. Top to bottom: WD 2359−434 (magnetic, red line), WD 2105−820 (magnetic, red line), WD 1952−206, WD 1826−045 (both non-magnetic, according to our new FORS data). Spectra are normalised to 1.0 at the edges of the window, then shifted vertically for display purposes. |
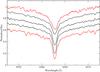 |
Fig. 3 Hα cores of four hot white dwarfs. Top to bottom: WD 0446−789 (magnetic according to Table 2, red line), WD 1620−391, WD 2039−202, WD 2007−303 (all with longitudinal field consistent with zero), WD 1105−048 (possibly magnetic, red line). |
Within the context of the SPY (Supernova Ia Progenitor surveY) project (Koester et al. 2009), high-resolution UVES spectra were obtained at two different epochs for each of the stars of Table 2, except for WD 0413−077 = 40 Eri B. We downloaded all these data from the UVES archive, to look for evidence of Zeeman splitting in the Hα line cores. The S/N in the continuum around Hα ranges from from 10 to over 100 per pixel ( = 0.03 Å). All spectra were smoothed with a running average over nine pixels, i.e., the profiles were smoothed to an effective resolution element of about 0.27 Å, which is still small compared to the FWHM of ≃ 1 Å for even the sharpest line cores.
Figure 2 shows the Hα line cores and inner wings of the cooler stars of Table 2, i.e., WD 2359−434, and WD 2105−820 (first and second spectra from the top, respectively, in red). Both of these spectra show evidence of Zeeman splitting. For comparison, Fig. 2 also shows the spectra of two non-magnetic cool white dwarfs of Table 1, WD 1826−045 and WD 1952−206 (third and fourth lines from top, respectively). The Hα cores of the two latter WDs show no significant excess width beyond that due to pressure broadening (see discussion by Koester et al. 1998).
As discussed in Sect. 3.1, Zeeman splitting of the Hα core of WD 2105−820 was already suspected by Koester et al. (1998); in the UVES data, with the smoothing adopted in Fig. 2, the line core appears fairly clearly split into the π and two σ components due to the Zeeman effect. The magnetic field of this star is further discussed in Sect. 5.
WD 2359−434 has been discussed by Koester et al. (1998) and by Koester et al. (2009), who interpret the profile as showing a sharp central π component and two broad σ components, which suggests a rather non-uniform field with a mean value of ⟨ | B | ⟩ ≈ 100 kG. A comparison between the the two available UVES spectra (which were obtained four days apart) shows evidence of slight variability. The small value of the ratio | ⟨ Bz ⟩ | / ⟨ | B | ⟩ ~ 0.04 suggests either that, if the field is roughly dipolar, we are looking at it from nearly in the plane of the magnetic equator, or that the field may be substantially more complex than a dipolar field, perhaps somewhat like WD 1953−011 (Valyavin et al. 2008).
Figure 3 shows the Hα cores for five hotter stars of Table 2. The top spectrum is that of WD 0446−789, which according to Table 2 has a field with ⟨ Bz ⟩ up to −6 kG. The Hα line core appears to show significant excess broadening compared to the others, probably due to Zeeman splitting corresponding to a 20 to 30 kG field. The two available UVES spectra, separated by a time interval of about four days, show only marginal signs of variability. The relatively high ratio | ⟨ Bz ⟩ | / ⟨ | B | ⟩ suggests that the star might have a roughly dipolar morphology, with a polar field strength of order 30 to 40 kG.
The remaining four Hα line cores of Fig. 3 show no evidence of Zeeman splitting, and none of them show any variation with time. Three of these spectra are those of stars which have longitudinal magnetic field consistent with zero (WD 1620−391, WD 2039−202, and WD 2007−303). The fourth unresolved core (the lowest in the figure) is that of WD 1105−048, which according to Table 2 has a field for which ⟨ Bz ⟩ ranges between −8 and + 3 kG. With ⟨ Bz ⟩ this large, we would expect a ⟨ | B | ⟩ value of the order of at least about 20 kG, or even more. It is therefore rather surprising that UVES spectra do not show any sign of Zeeman broadening or splitting.
5. A simple magnetic model for WD 2105−820
WD 2105−820 is the only kG MWD for which there exists a sufficiently large number of magnetic field measurements to allow us to start simple modelling.
Four of our longitudinal field measurements were obtained during one week, and the fifth one about one month later. During this time interval, the field shows at most marginal evidence of variability, and the observed fluxes show none.
Mean field modulus measurements made by Koester et al. (1998) from CASPEC observations of excess Hα line core broadening (which we can now safely ascribe to the Zeeman effect) yield a field strength ⟨ | B | ⟩ of 43 ± 10 kG. Although all three observations have very low S/N, it appears that the three Hα profiles show similar Zeeman broadening. The first two measurements were obtained on 1995 July 13, and the last on 1996 July 29, i.e., about a year later (D. Koester, priv. comm.). In addition, two further high-resolution spectra of this star containing Hα were obtained with UVES for the SPY project (Koester et al. 2009), one on 2002 May 29, and one on 2003 May 13 (see Sect. 4.4). Koester et al. (2009) remark that the excess broadening of Hα in these spectra is very similar in width to that observed in the three older spectra, and thus they find no evidence that ⟨ | B | ⟩ has changed. The S/N of the 2003 spectrum is too low to make possible an accurate determination of ⟨ | B | ⟩ , but in the 2002 spectrum, the Hα core appears to show the π and two σ components clearly, with a σ − σ separation of ~ 1.7 Å, corresponding to ⟨ | B | ⟩ = 42 ± 3 kG. Since the available Stokes I measurements were obtained over a span of eight years, we conclude that the observed mean field modulus of WD 2105−820 does not change much even over a time scale of a decade.
Assuming that the star’s magnetic model can be described in terms of the oblique rotator model, which seems to be generally true of MWDs that have been modelled in detail (Landstreet 1992; Külebi et al. 2009b), these results indicate that either (1) the stellar rotation period is much longer than one year (or possibly shorter than the integration time of the observations), or that the magnetic structure is such that the observed field does not vary much as the star rotates, i.e., (2) the field is roughly symmetric about the rotation axis, or (3) the rotation axis is nearly aligned to the line of sight.
We note that none of the variable MWDs with known periods discussed by Schmidt & Norsworthy (1991) or Kawka et al. (2007, see also Table 2Landstreet 1992) have rotation periods longer than 18 days (and only one has a rotation period significantly shorter than 1 h). Thus we consider the hypothesis of a field approximately symmetric about the star’s rotation axis, or possibly of a stellar rotation axis nearly parallel to the line of sight.
We furthermore note that the value of the ratio ⟨ Bz ⟩ / ⟨ | B | ⟩ ≈ 0.22 is a strong indicator of a rather simple magnetic field structure (a much smaller value is expected for complex fields such as those of solar-type stars). In particular, the value of this ratio is consistent with a dipolar morphology (Landstreet 1988; Schmidt & Norsworthy 1991), which we adopt as a magnetic model for WD 2105−820. We note that in their modelling of DAH stars with stronger fields, Külebi et al. (2009b) frequently obtained better fits to their (time-averaged) I spectra with decentred dipoles than with centred ones, but for the weak field of WD2105−820 we do not have a strong constraint on possible decentring in the available data.
If we assume that the magnetic field is symmetric about the star’s rotation axis, then the dipolar axis must be parallel to the stellar rotation axis. Using Eqs. (1), (2), (6), (8), and (21) of Hensberge et al. (1977) (setting the limb darkening coefficient to 1, ⟨ Bz ⟩ = const = 10 kG, ⟨ | B | ⟩ = const. = 43 kG), we find that the observations are consistent with a simple centred dipole with a polar field strength of ~ 56 kG, and magnetic axis parallel to the rotation axis inclined at about ~ 68° with respect to the line of sight. If we assume a rotation axis parallel to the line of sight, then magnetic field observations are explained again by a dipole with field strength at the pole of ~ 56 kG, but with dipole axis tilted at ~ 68° with respect to the rotation axis (which is parallel to the line of sight). Note that the field models obtained in the two cases are the same; the only difference between the models is that the inclination of the rotation axis to the line of sight i, and the obliquity angle between the rotation and dipole axes β, have been exchanged.
6. Discussion and conclusions
The database that we have considered includes 20 hot DA stars (generally spectral type DA1 to DA4, Teff ≳ 14 000 K) and 15 cool DA stars (spectral type DA5 to DA8; Teff ≲ 14 000 K). (We omit 40 Eri B from our sample, as we have no data to confirm the field detected, and the star was not observed in a survey of known size.) Since there are two firmly detected MWDs in each of the hot and cool samples, we conclude that detection rates are about 10% for the hot sample, and 13% for the cool sample. The small size of the sample and the small number of detections set a serious limit to accuracy of these frequency estimates. Using the Wilson 95% confidence limits (Wilson 1927), the field detection rate in hot WDs could be anywhere between 2.8 and 30%, while the field detection rate in cool DA WDs lies between 3.7 and 38%. In conclusion, the data currently available are consistent with the hypothesis that weak magnetic fields occur with the same frequency in hot and cool DA WDs. Globally, the detection of four weak magnetic fields from a total sample of 36 WDs makes it quite clear that the probability of finding a weak field in a DA WD is neither negligible, nor close to 1; at the 95% confidence limits, the probability lies between 4 and 25%. Therefore, it appears that the probability of detecting a ~ 10 kG field in a WD is comparable to the probability of detecting a magnetic field with strength in the range 100 kG–500 MG, which is ~ 10%.
Re-addressing some of the questions posed in Sect. 1, it appears now that ~ 10 kG longitudinal fields are not ubiquitous in WDs lacking stronger fields, nor do fields seem to die away at this level. Furthermore, we have not found any significant difference between field detection rates in cool, old WDs and field detection rate in hot, young WDs. Studying these questions further will require substantially larger samples of precise field measurements than those available now.
The results of this paper highlight the need for (1) further field measurement of the MWDs already detected in this low-field regime, to fully confirm the reported detections, and to provide data on possible variabilty in order to characterise the field structures observed; (2) an extended high-precision survey of magnetic fields in hot and cool WDs, aimed at refining the frequency of occurrence of weak fields in the range studied here; and (3) a still deeper survey, using long integrations, to reach even weaker fields (note that standard errors of 300−500 G are already achieved in a number of stars with integrations of mostly less than 30 min). It will also be interesting to discover whether the morphologies of the fields of kG MWDs are often roughly symmetric about the rotation axis, as seems to be the case for WD 2105−820 and as frequently happens for MWDs with stronger fields. All of these goals are within reach of observing programmes on the VLT with FORS2, although they would be very difficult on smaller telescopes.
After this paper was accepted, S. Vennes communicated to us the results of a survey of magnetic fields in a sample of 58 high proper motion white dwarfs (Kawka & Vennes 2012). The stars of their survey are complementary to the two samples discussed in our paper. Our hot sample contains stars with typical cooling ages of 300 Myr or less, and our cool sample WDs typically have cooling ages of 300–1000 Myr, while the sample of Kawka & Vennes is made up largely of stars with cooling ages above 1 Gyr. Because the WDs observed by Kawka & Vennes are both cooler and typically 2–3 mag fainter than those of our samples, their median standard error of field measurement is about 3 kG, compared to about 800 G for our sample. They are thus sensitive mainly to ⟨ Bz ⟩ fields larger than 10–20 kG, just above the ⟨ Bz ⟩ range of greatest interest to our study. However, their results seem to be significantly different from ours, as they find a probability of field detection of the order of 1–2% per decade of field strength, while the samples discussed by us suggest probabilities of the order of 10% per decade in the weak-field limit. Further observations will be needed to determine if this difference is real. If the difference is indeed real, it may be an evolutionary effect of field decay with time, or a real increase in probability as we probe smaller and smaller field strengths.
Online material
Revised ⟨ Bz ⟩ field strength values for all magnetic field measurements of potential kG field DA white dwarfs, obtained from H Balmer lines only.
Our programme was granted the status of “filler”, and only a fraction of the observations originally planned were actually carried out.
Acknowledgments
We thank the referee, Prof. Gary Schmidt, for a careful reading of the manuscript and for helpful comments. J.D.L. and G.A.W. acknowledge financial support from the Natural Sciences and Engineering Research Council of Canada.
References
- Aurière, M., Wade, G. A., Silvester, J., et al. 2007, A&A, 475, 1053 [NASA ADS] [CrossRef] [EDP Sciences] [Google Scholar]
- Aznar Cuadrado, R., Jordan, S., Napiwotzki, R., et al. 2004, A&A, 423, 1081 [NASA ADS] [CrossRef] [EDP Sciences] [Google Scholar]
- Bagnulo, S., Landolfi, M., Landstreet, J. D., et al. 2009, PASP, 121, 993 [NASA ADS] [CrossRef] [Google Scholar]
- Bagnulo, S., Landstreet, J. D., Fossati, L., & Kochukhov, O. 2012, A&A, 538, A129 [NASA ADS] [CrossRef] [EDP Sciences] [Google Scholar]
- Fabrika, S. N., Valyavin, G. G., & Burlakova, T. E. 2003, Aston. Lett., 29, 737 [Google Scholar]
- Greenstein, J. L. 1984, ApJ, 281, L47 [NASA ADS] [CrossRef] [Google Scholar]
- Giammichele, N., Bergeron, P., & Dufour, P. 2012, ApJS, 199, 29 [NASA ADS] [CrossRef] [Google Scholar]
- Jordan, S. 1992, A&A, 265, 570 [NASA ADS] [Google Scholar]
- Jordan, S., Aznar Cuadrado, R., Napiwotzki, R., Schmid, H. M., & Solanki, S. K. 2007, A&A, 462, 1097 [NASA ADS] [CrossRef] [EDP Sciences] [Google Scholar]
- Jordan, S., Bagnulo, S., Klaus, W., & O’Toole, S. J. 2012, A&A, 542, A64 [NASA ADS] [CrossRef] [EDP Sciences] [Google Scholar]
- Hensberge, H., van Rensbergen, W., Deridder, G., & Goossens, M. 1977, A&A, 61, 235 [NASA ADS] [Google Scholar]
- Kawka, A., Vennes, S., Schmidt, G. D., Wickramasinghe, D. T., & Koch, R. 2007, ApJ, 654, 499 [NASA ADS] [CrossRef] [Google Scholar]
- Kawka, A., & Vennes, S. 2012, MNRAS, 425, 1394 [NASA ADS] [CrossRef] [Google Scholar]
- Kemp, J. C., Swedlund, J. B., Landstreet, J. D., & Angel, J. R. P. 1970, ApJ, 161, L77 [NASA ADS] [CrossRef] [Google Scholar]
- Koester, D., Dreizler, S., Weidemann, V., & Allard, N. F. 1998, A&A, 338, 612 [NASA ADS] [Google Scholar]
- Koester, D., Voss, B., Napiwotzki, R., et al. 2009, A&A, 505, 441 [NASA ADS] [CrossRef] [EDP Sciences] [Google Scholar]
- Külebi, B., Jordan, S., Euchner, F., Hirsch, H., & Löffler, W. 2009a, JPhCS, 172a, 2047 [NASA ADS] [Google Scholar]
- Külebi, B., Jordan, S., Euchner, F., Gänsicke, B. T., & Hirsch, H. 2009b, A&A, 506, 1341 [NASA ADS] [CrossRef] [EDP Sciences] [Google Scholar]
- Lajoie, C.-P., & Bergeron, P. 2007, ApJ, 667, 1126 [NASA ADS] [CrossRef] [Google Scholar]
- Landstreet, J. D. 1982, ApJ, 258, 639 [NASA ADS] [CrossRef] [Google Scholar]
- Landstreet, J. D. 1988, ApJ, 326, 967 [NASA ADS] [CrossRef] [Google Scholar]
- Landstreet, J. D. 1992, A&ARv, 4, 35 [NASA ADS] [CrossRef] [Google Scholar]
- Landstreet, J. D., Bagnulo, S., Fossati, L., Jordan, S., & O’Toole, S. J. 2012, A&A, 541, A100 [NASA ADS] [CrossRef] [EDP Sciences] [Google Scholar]
- Liebert, J. 1988, PASP, 100, 1302 [NASA ADS] [CrossRef] [Google Scholar]
- Liebert, J., Bergeron, P., & Holberg, J. B. 2003, ApJ, 125, 248 [Google Scholar]
- Schmidt, G. D. 2001, ASPCS, 248, 443 [NASA ADS] [Google Scholar]
- Schmidt, G. D., & Norsworthy, J. E. 1991, ApJ, 366, 270 [NASA ADS] [CrossRef] [Google Scholar]
- Valyavin, G. G., & Fabrika, S. N. 1998, BSAO, 45, 69 [Google Scholar]
- Valyavin, G., Bagnulo, S., & Fabrika, S., et al. 2006, ApJ, 648, 559 [NASA ADS] [CrossRef] [Google Scholar]
- Valyavin, G., Wade, G. A., Bagnulo, S., et al. 2008, ApJ, 683, 466 [NASA ADS] [CrossRef] [Google Scholar]
- Wickramasinghe, D. T., & Ferrario, L. 1988, ApJ, 327, 222 [NASA ADS] [CrossRef] [Google Scholar]
- Wilson, E. B. 1927, J. Am. Stat. Assn., 22, 209 [CrossRef] [Google Scholar]
All Tables
Revised ⟨ Bz ⟩ field strength values for all magnetic field measurements of potential kG field DA white dwarfs, obtained from H Balmer lines only.
All Figures
|
Fig. 1 Observations of WD 2105−820 obtained with FORS1 on 2004-08-10 UT 05:01 = MJD 53 227.209. The top panel shows the observed flux F (black solid line, in arbitrary units, and not corrected for the instrument response), the PV = V / I profile (red solid line centred about 0), and the null profile NV (blue solid line, offset by −2.75% for display purpose). The null profile is expected to be centred about zero and scattered according to a Gaussian with σ given by the PV error bars, which are represented with light blue bars centred about −2.75%. The regions used for field measurement are marked with green bars above and below this spectrum. The slope of the interpolating lines in the bottom panels provides the mean longitudinal field from PV (left bottom panel) and from the null profile (right bottom panel) both calculated using only the H Balmer lines. The corresponding ⟨ Bz ⟩ and ⟨ Nz ⟩ values are 9770 ± 843 G and −11 ± 868 G, respectively. |
| In the text | |
|
Fig. 2 Hα cores of four cool WDs. Top to bottom: WD 2359−434 (magnetic, red line), WD 2105−820 (magnetic, red line), WD 1952−206, WD 1826−045 (both non-magnetic, according to our new FORS data). Spectra are normalised to 1.0 at the edges of the window, then shifted vertically for display purposes. |
| In the text | |
|
Fig. 3 Hα cores of four hot white dwarfs. Top to bottom: WD 0446−789 (magnetic according to Table 2, red line), WD 1620−391, WD 2039−202, WD 2007−303 (all with longitudinal field consistent with zero), WD 1105−048 (possibly magnetic, red line). |
| In the text | |
Current usage metrics show cumulative count of Article Views (full-text article views including HTML views, PDF and ePub downloads, according to the available data) and Abstracts Views on Vision4Press platform.
Data correspond to usage on the plateform after 2015. The current usage metrics is available 48-96 hours after online publication and is updated daily on week days.
Initial download of the metrics may take a while.