Fig. 8
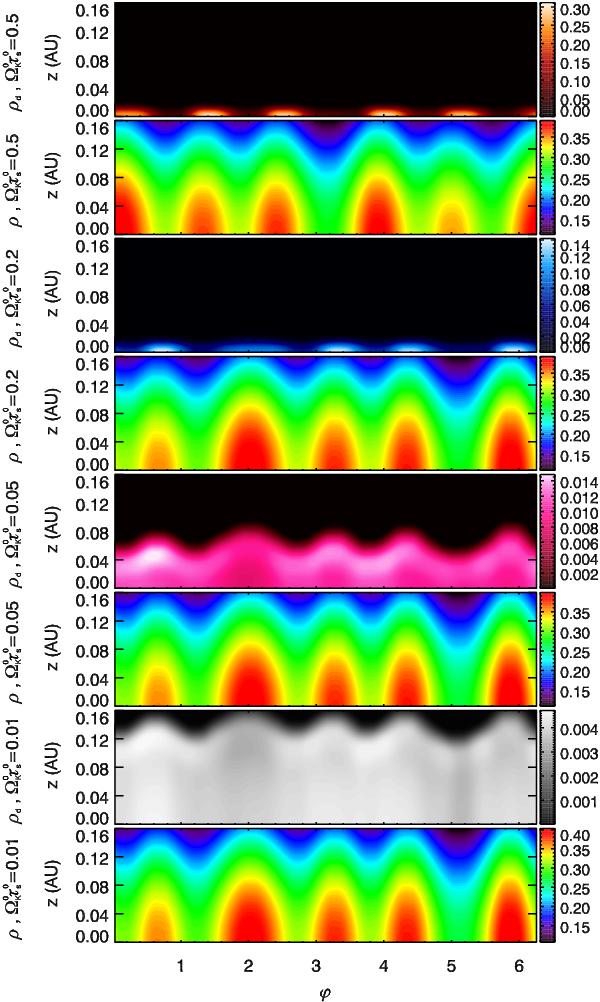
Vertical density profiles in the vortices (r/r0 = 3) after 3 rotations for three different population of dust:  , 0.01 and for the gas in each of theses cases. As the ranges of density vary a lot between populations, different colour tables are used to avoid misunderstandings. The position of the vortices is not the same in the 5 cm grain simulation due to the back reaction of the dust on the gas as explained in Sect. 4.4. A colour version of this figure is accessible in the electronic version of this paper.
Current usage metrics show cumulative count of Article Views (full-text article views including HTML views, PDF and ePub downloads, according to the available data) and Abstracts Views on Vision4Press platform.
Data correspond to usage on the plateform after 2015. The current usage metrics is available 48-96 hours after online publication and is updated daily on week days.
Initial download of the metrics may take a while.