Free Access
Fig. 6
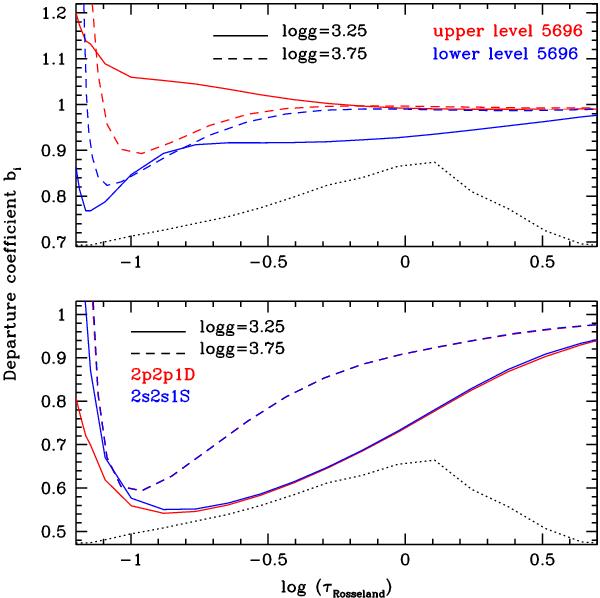
Effect of log g on departure coefficients. Departure coefficients are plotted as a function of Rosseland opacity for the levels on C iii 5696 (upper panel) and for the fundamental level (2s2 1S) and the lower level of C iii 884 (2p2 1D). The dotted line shows the C iii 5696 line formation region.
Current usage metrics show cumulative count of Article Views (full-text article views including HTML views, PDF and ePub downloads, according to the available data) and Abstracts Views on Vision4Press platform.
Data correspond to usage on the plateform after 2015. The current usage metrics is available 48-96 hours after online publication and is updated daily on week days.
Initial download of the metrics may take a while.