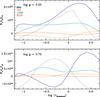
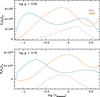
Fig. 5

Effect of log g on the formation of C iii 5696 for Teff = 30 500 K. Left: total radiative rates out of level 2s3p 1Po at log g = 3.25 (upper panel) and log g = 3.75 (lower panel) as a function of Rosseland opacity. Notice how the largest rate is for λ 884, and that this rate shows a qualitatively different behavior in the two models. The dotted lines indicate the C iii 5696 line formation region. Right: total radiative rates out of level 2s3d 1D at log g = 3.25 (upper panel) and log g = 3.75 (lower panel).
Current usage metrics show cumulative count of Article Views (full-text article views including HTML views, PDF and ePub downloads, according to the available data) and Abstracts Views on Vision4Press platform.
Data correspond to usage on the plateform after 2015. The current usage metrics is available 48-96 hours after online publication and is updated daily on week days.
Initial download of the metrics may take a while.