Free Access
Fig. D.1
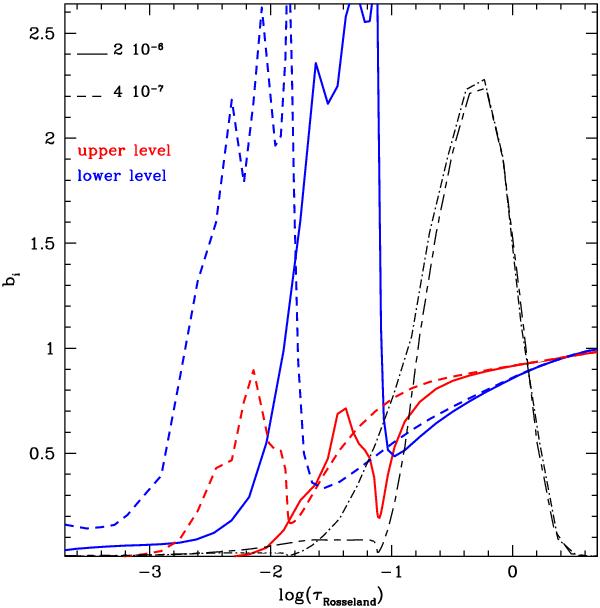
Effects of mass loss rate on 2s3p 1Po (blue) and 2s3d 1D (red) departure coefficients in a model with Teff = 42 000 K. The dashed (solid) lines corresponds to a model with Ṁ = 4 × 10⁻⁷ (2 × 10⁻⁶) M⊙ yr-1. The dot-dashed (short dash – long dashed) line is the line formation region in the low (high) Ṁ model.
Current usage metrics show cumulative count of Article Views (full-text article views including HTML views, PDF and ePub downloads, according to the available data) and Abstracts Views on Vision4Press platform.
Data correspond to usage on the plateform after 2015. The current usage metrics is available 48-96 hours after online publication and is updated daily on week days.
Initial download of the metrics may take a while.