Fig. 16
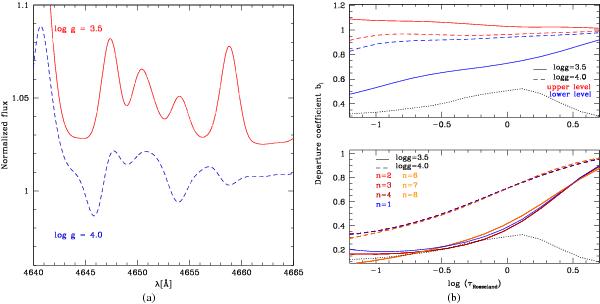
Effect of log g on C iii 4647–50–51. Left panel: the red line is a model with log g = 3.5; the blue line is the same model with log g = 4.0. The effective temperature is 42 000 K. Right panel: departure coefficient of the upper and lower levels of C iii 4647–50–51 (upper panel) and of levels 2s2 1S (n = 1), 2s2p 3Po (n = 2,3,4), 2p2p 3D (n = 6,7,8) (lower panel) for log g = 3.5 (solid line) and log g = 4.0 (dashed line), plotted as a function of Rosseland opacity. The dotted line is the C iii 4650 formation region.
Current usage metrics show cumulative count of Article Views (full-text article views including HTML views, PDF and ePub downloads, according to the available data) and Abstracts Views on Vision4Press platform.
Data correspond to usage on the plateform after 2015. The current usage metrics is available 48-96 hours after online publication and is updated daily on week days.
Initial download of the metrics may take a while.