Fig. 11
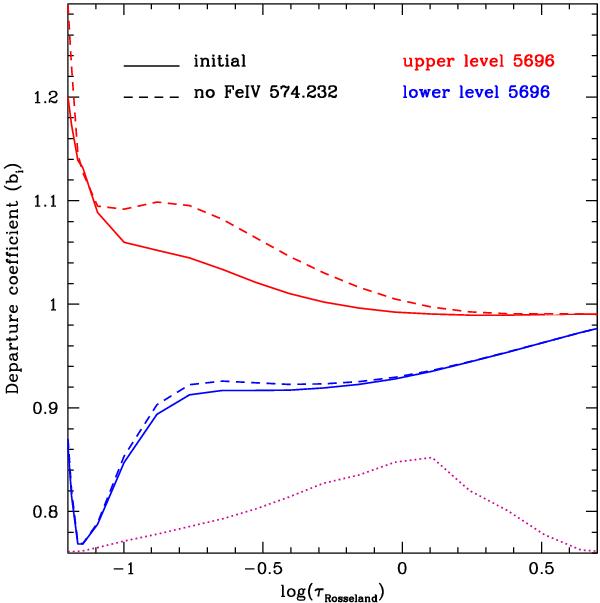
Effect of a change in the oscillator strength of Fe iv 574.232 Å on the departure coefficient (plotted as a function of Rosseland opacity) of the levels of the C iii 5696 transition. The red curves correspond to the upper level and the blue ones to the lower level. The solid lines are for the initial model. The dashed lines are the level populations in the model with a reduced Fe iv 574.232 line. The dotted line is the C iii 5696 formation region.
Current usage metrics show cumulative count of Article Views (full-text article views including HTML views, PDF and ePub downloads, according to the available data) and Abstracts Views on Vision4Press platform.
Data correspond to usage on the plateform after 2015. The current usage metrics is available 48-96 hours after online publication and is updated daily on week days.
Initial download of the metrics may take a while.