Fig. 5
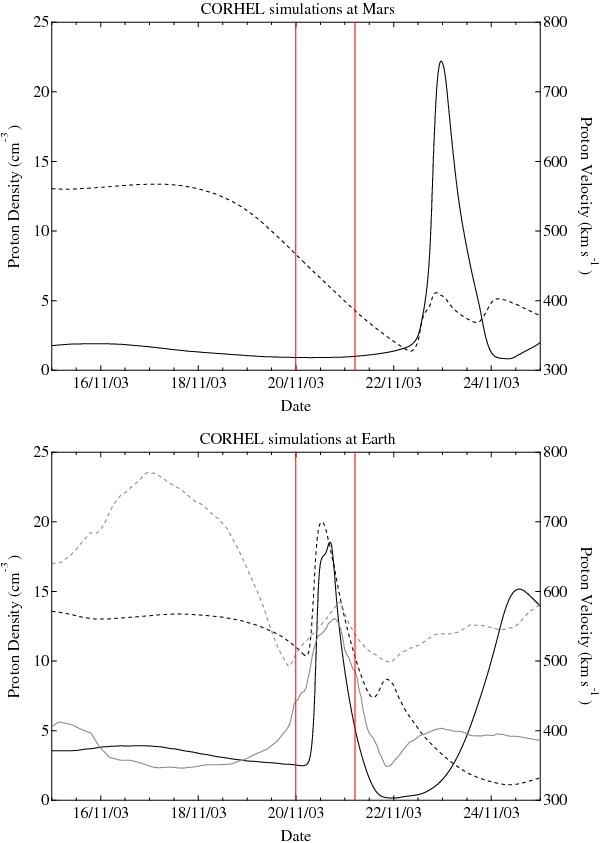
Top – simulated proton density (solid) and velocity (dashed) calculated with the CORHEL model for the Mars orbit for the2003/11/18 CME propagating through interplanetary space. According to the simulations the perturbed CME plasma arrived at Mars about a day and a half after the XMM-Newton exposure (represented by the vertical lines). Bottom – same as top only calculated for the Earth orbit. ACE 1-day gliding averages of density and velocity measurements are also plotted in gray for comparison.
Current usage metrics show cumulative count of Article Views (full-text article views including HTML views, PDF and ePub downloads, according to the available data) and Abstracts Views on Vision4Press platform.
Data correspond to usage on the plateform after 2015. The current usage metrics is available 48-96 hours after online publication and is updated daily on week days.
Initial download of the metrics may take a while.