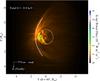
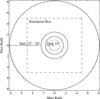
Fig. 4
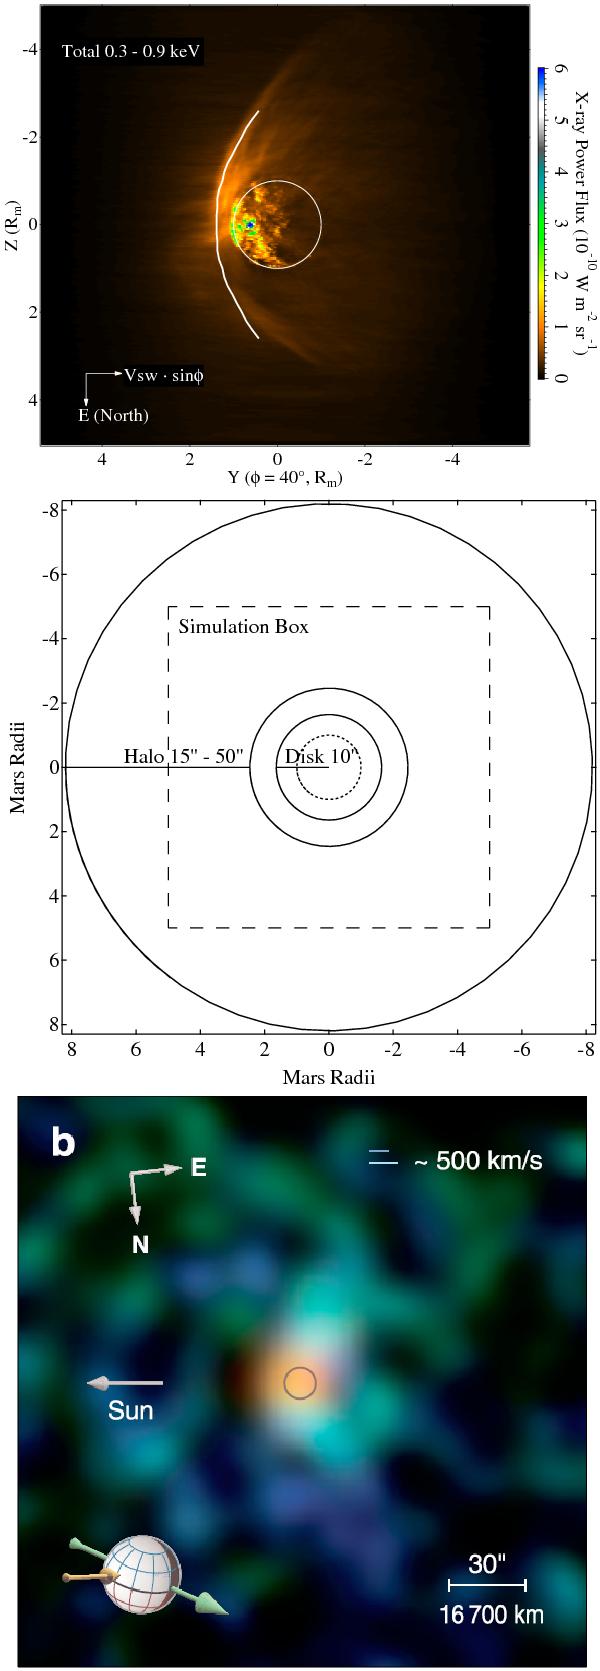
Top – Total CX-induced X-ray power flux map from Mars in units of W m-2 sr-1, in the same projection as the XMM-Newton observation, at a φ = 40° phase angle. Axes are in Mars radii. The planet is represented by the white circle, and the white curve marks the MBS position based on MGS data (Vignes et al. 2000). The B − Vsw plane corresponds to the ecliptic and the electric field (E) axis points north. North points downward for direct comparison with Dennerl et al. (2006)’s figure 8 reproduced in the bottom panel. Middle – size of our simulation box projection at a 40° angle (dashed square), compared to Mars’ X-ray disk (r < 10″) and halo (15″ < r < 50″) sizes defined by Dennerl et al. (2006). Mars is represented by the dotted circle. Bottom – reproduction of Dennerl et al. (2006)’s Fig. 8. The scale is not the same as in the top two panels. A color version of this figure is available in the online journal.
Current usage metrics show cumulative count of Article Views (full-text article views including HTML views, PDF and ePub downloads, according to the available data) and Abstracts Views on Vision4Press platform.
Data correspond to usage on the plateform after 2015. The current usage metrics is available 48-96 hours after online publication and is updated daily on week days.
Initial download of the metrics may take a while.