Fig. 2
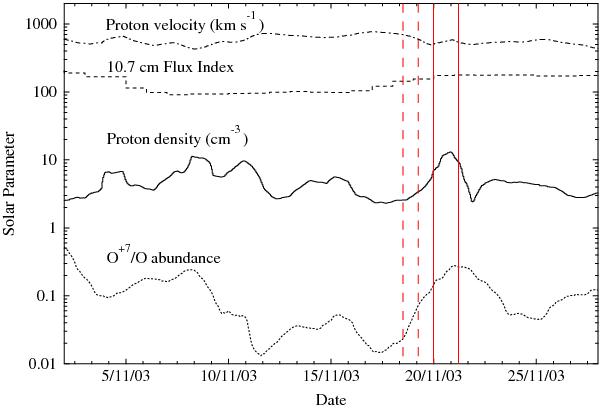
Solar parameters measured by near-Earth instruments during the three months preceding the XMM-Newton observation of Mars in November 2003. From top to bottom the curves represent, averaged over 3 solar rotations (81 days): proton velocity in km s-1 (dot-dashed), the F10.7-cm flux index (dashed), proton density in cm-3 (solid) and O+7/O relative abundance (dotted). In-situ data are from ACE at L1, while the radio flux indices were taken from the NOAA Space Weather Prediction Center. The solid vertical lines show the start and end of the XMM-Newton observation of Mars, and the dashed vertical lines show the SW event window applied to the simulations, once the Earth-Mars SW delay time is taken into account.
Current usage metrics show cumulative count of Article Views (full-text article views including HTML views, PDF and ePub downloads, according to the available data) and Abstracts Views on Vision4Press platform.
Data correspond to usage on the plateform after 2015. The current usage metrics is available 48-96 hours after online publication and is updated daily on week days.
Initial download of the metrics may take a while.