Free Access
Fig. 4
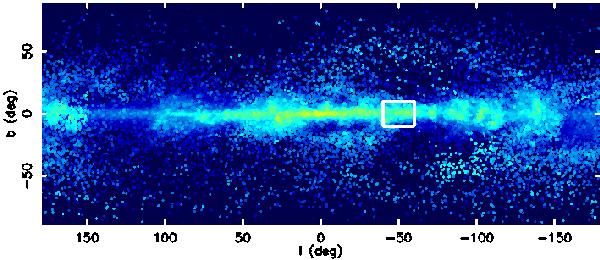
Gas distribution in a Galactic coordinate of the simulated galaxy shown in Fig. 3. The region enclosed by the white lines are the selected region for constructing the CMD shown in Fig. 5. The colour coding is by density, so that bluer and more yellow points represent higher and lower density particles respectively.
Current usage metrics show cumulative count of Article Views (full-text article views including HTML views, PDF and ePub downloads, according to the available data) and Abstracts Views on Vision4Press platform.
Data correspond to usage on the plateform after 2015. The current usage metrics is available 48-96 hours after online publication and is updated daily on week days.
Initial download of the metrics may take a while.