Fig. 2
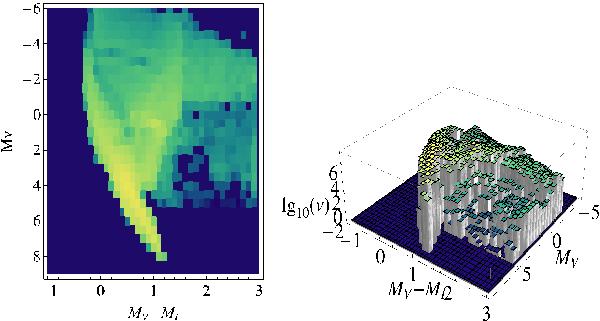
Left panel: the CSP for an N-body simulation of a disc galaxy. Colour code refers to the frequency of star per bin shown in the companion right panel. Right panel: the histogram of DF for the CSP shown in the left panel. In this figure, one immediately captures the concept of DF described in the text. The characteristic peaks corresponding to MS and RGB stars are shown in yellow. The CMDs have the coordinates of the absolute magnitudes MV and the colours MV − MI.
Current usage metrics show cumulative count of Article Views (full-text article views including HTML views, PDF and ePub downloads, according to the available data) and Abstracts Views on Vision4Press platform.
Data correspond to usage on the plateform after 2015. The current usage metrics is available 48-96 hours after online publication and is updated daily on week days.
Initial download of the metrics may take a while.