Fig. 1
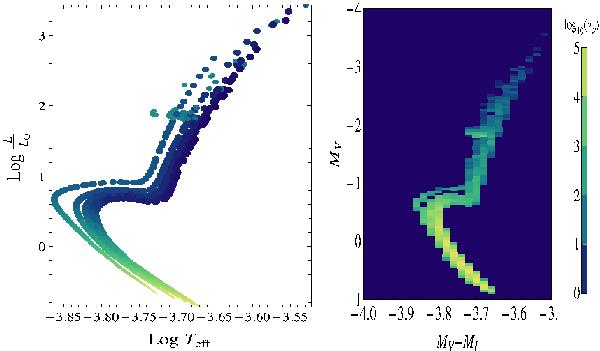
Left panel: the HRD of SSPs with assigned age and metallicity. The size of the circles indicates the current star mass along the isochrones and/or SSP. The stellar models in use are taken from the library of Bertelli et al. (2008, 2009). The colour code refers to the size of the dots: the smaller is the dot, the more yellow it is and the smaller the mass of the plotted stars. The bigger the dot, the bluer its colour and the bigger the mass of the stars. The mass considered in the models of this example ranges from 0.15 to 20 M⊙. Right panel: the same SSPs displayed in the left panel but in the observational CMD MV vs. MV − MI. The CMD is subdivided to a discrete grid of elemental cells, in each of which a certain number of stars fall. The stars in each cell may belong to different SSPs. The size of the cell is large clearly show evidence the “out-of-focus” effect intrinsic to this tessellation technique. Colour-code spans account for the number of stars in the cells from 0 (the bluer colour) to 105 (the light yellow colour).
Current usage metrics show cumulative count of Article Views (full-text article views including HTML views, PDF and ePub downloads, according to the available data) and Abstracts Views on Vision4Press platform.
Data correspond to usage on the plateform after 2015. The current usage metrics is available 48-96 hours after online publication and is updated daily on week days.
Initial download of the metrics may take a while.