Fig. 5
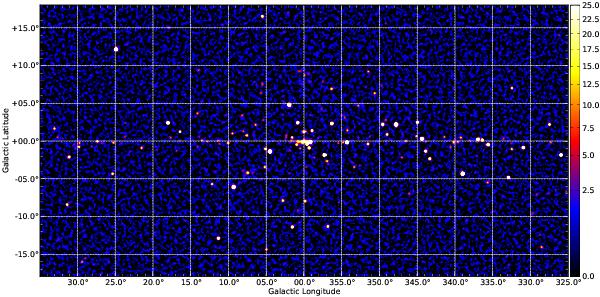
INTEGRAL/IBIS hard X-ray (35 − 80 keV) map of the sky region around the GC. The total exposure is about 26 Ms in the GC region. The image is shown in terms of S/N with the color map ranging from values of 0 to 25. This color scheme is used to emphasize sky background variations. Figure 6 demonstrates a corresponding S/N distribution of pixels.
Current usage metrics show cumulative count of Article Views (full-text article views including HTML views, PDF and ePub downloads, according to the available data) and Abstracts Views on Vision4Press platform.
Data correspond to usage on the plateform after 2015. The current usage metrics is available 48-96 hours after online publication and is updated daily on week days.
Initial download of the metrics may take a while.