Free Access
Fig. 4
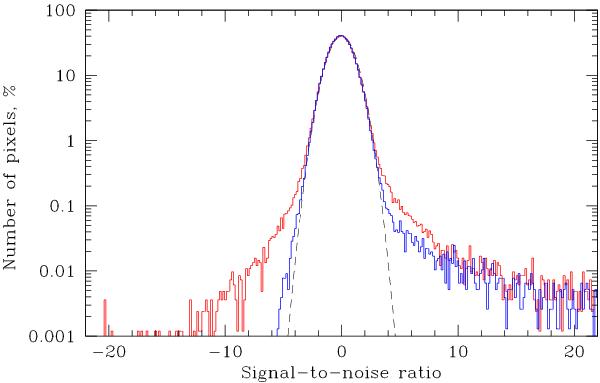
Signal-to-noise ratio distribution of a number of pixels in the 17 − 60 keV map of Fig. 3. Red and blue histograms show distributions of pixels in full and masked images, respectively. The dashed line represents the normal distribution with unit variance and zero mean.
Current usage metrics show cumulative count of Article Views (full-text article views including HTML views, PDF and ePub downloads, according to the available data) and Abstracts Views on Vision4Press platform.
Data correspond to usage on the plateform after 2015. The current usage metrics is available 48-96 hours after online publication and is updated daily on week days.
Initial download of the metrics may take a while.