Free Access
Fig. 3
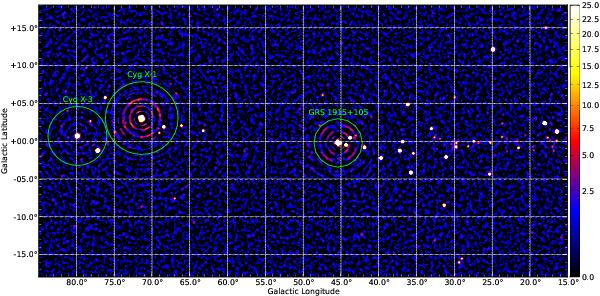
INTEGRAL/IBIS hard X-ray (17−60 keV) map of the sky region of Cyg X-1, Cyg X-3, and GRS 1915+105 at l = +50° with masked area shown as green circles. The corresponding S/N distribution of pixels is shown in Fig. 4.
Current usage metrics show cumulative count of Article Views (full-text article views including HTML views, PDF and ePub downloads, according to the available data) and Abstracts Views on Vision4Press platform.
Data correspond to usage on the plateform after 2015. The current usage metrics is available 48-96 hours after online publication and is updated daily on week days.
Initial download of the metrics may take a while.