Fig. 5
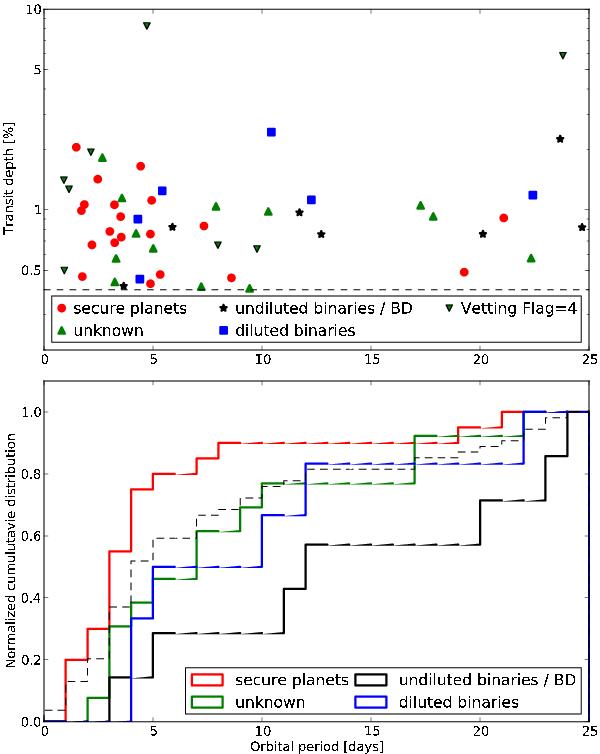
(Top panel) Transit depth of the 46 selected KOIs as a function of their orbital period. The different marks represent the different nature of the candidate. The dashed line represents the cut in transit depth applied to this selection. (Lower panel) Normalized cumulative distributions of the orbital period of the different classes of candidates. The dashed black line displays the normalized cumulative distribution of the 46 selected candidates.
Current usage metrics show cumulative count of Article Views (full-text article views including HTML views, PDF and ePub downloads, according to the available data) and Abstracts Views on Vision4Press platform.
Data correspond to usage on the plateform after 2015. The current usage metrics is available 48-96 hours after online publication and is updated daily on week days.
Initial download of the metrics may take a while.