Fig. 4
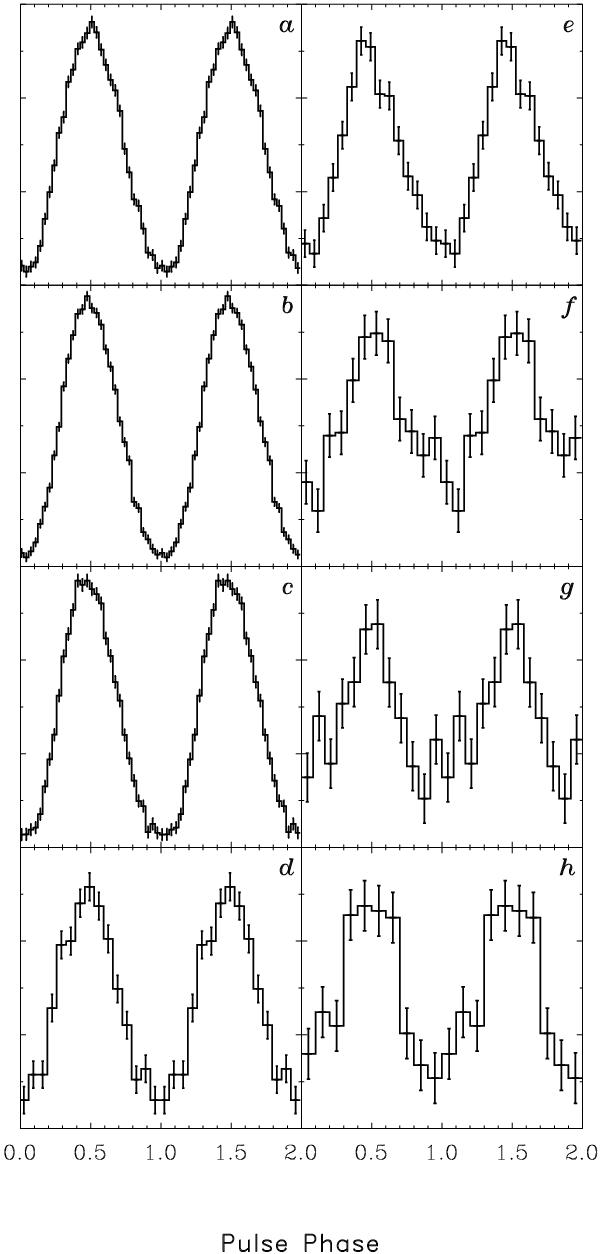
Pulse-profile collage of IGR J17498–2921 using data from RXTE/PCA, HEXTE, and INTEGRAL/ISGRI. Panels a)–d) (PCA) correspond to the energy intervals 1.6–4.1, 4.1–8.7, 8.7–18.4, and 18.4–37.0 keV, respectively. Panels e), f) show the HEXTE pulse profiles in the bands 15.6–31.0 keV and 31.0–65.1 and in panels g), h) the ISGRI profiles for the bands 20–30 keV and 30–65 keV. The error bars represent 1σ statistical errors. All profiles reach their maximum near phase ~0.5. The y-axis is given in units of counts per bin.
Current usage metrics show cumulative count of Article Views (full-text article views including HTML views, PDF and ePub downloads, according to the available data) and Abstracts Views on Vision4Press platform.
Data correspond to usage on the plateform after 2015. The current usage metrics is available 48-96 hours after online publication and is updated daily on week days.
Initial download of the metrics may take a while.