Fig. 5
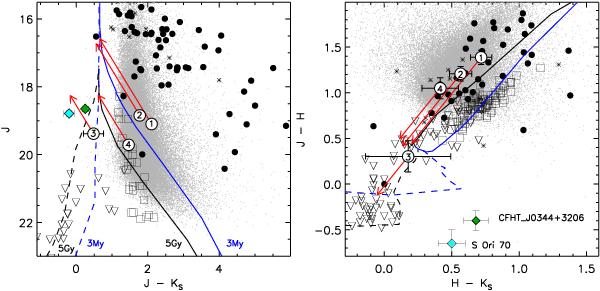
J vs. J − KS (left panel) and J − H vs. H − KS diagrams (right panel) for the point-like objects detected in Serpens Core (small grey dots). The circles with error bars are the T-dwarf candidates in this study; their ID number is indicated and the arrows indicate their position after correction for interstellar reddening. The Serpens Core class II (black dots) and class III (asterisks) YSO population, the S Ori 70 mid-T dwarf (sky-blue diamond) and the CFHT_J0344+3206 mid-T dwarf candidate (green diamond) are plotted for comparison. The squares and triangles show the location of confirmed field L and T dwarfs (Chiu et al. 2006; Golimowski et al. 2004; Knapp et al. 2004), respectively, shifted to the distance of Serpens. Lines show the 5 Gyr and 3 My COND isochrones (dashed lines) and the 5 Gyr and 3 My DUSTY isochrones (continuous line).
Current usage metrics show cumulative count of Article Views (full-text article views including HTML views, PDF and ePub downloads, according to the available data) and Abstracts Views on Vision4Press platform.
Data correspond to usage on the plateform after 2015. The current usage metrics is available 48-96 hours after online publication and is updated daily on week days.
Initial download of the metrics may take a while.